Table of Contents
Viewlin
Intorduction
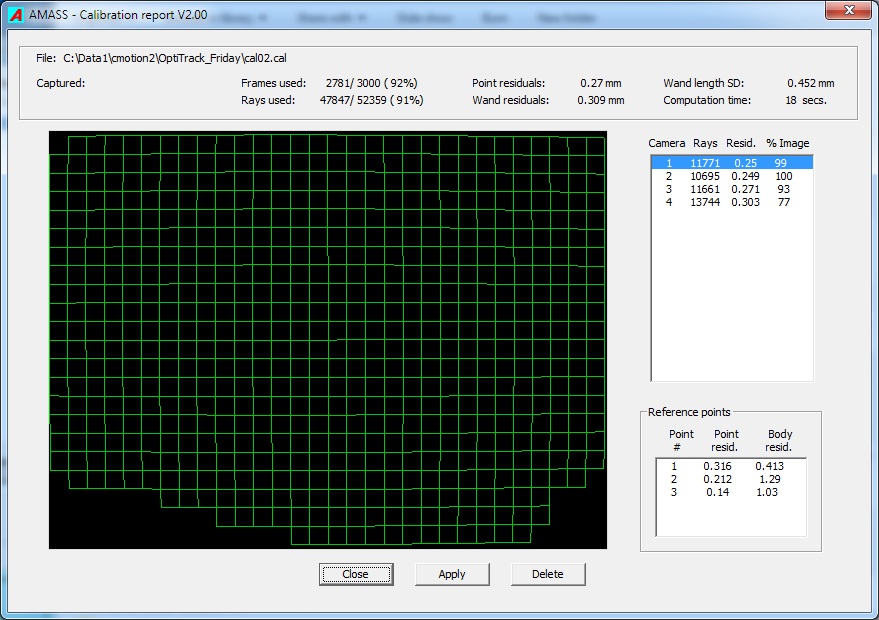
A report on a successful calibration may be displayed by the ViewLin utility program. It can be launched by selecting one or more .cal files in the AMASS shell Input files box and then clicking on the ViewLin function button. It will also be automatically started after each calibration provided the ViewLin box is checked in the calibration parameters. This program may also be run in stand-alone mode.
The main graphics window shows the area of a selected camera’s image that was calibrated, with the grid indicating the lens distortions present for that camera. The camera whose image is to be displayed can be selected in the list box to the right of the graphics window, or by use of arrow keys.
Main group box
- File The first line indicates the name of the calibration file.
- Frames used The number of frames actually used / the total number of frames available for the calibration (also expressed as a percentage). Frames may be excluded for various reasons including the wand being out of view to most cameras, too many “junk” markers, and inability of the program to track the marker images in the cameras’ views.
- Rays used The number of rays actually used / the total number of rays available. This is a similar measure to the previous one, but pertains to the total number of rays (a ray is defined as the line from a marker to the center of a camera’s lens) that were measured. Again a ray can be excluded for a number of reasons such as; a marker is partially obscured, it is only observed by one camera, it cannot be identified as being part of the wand, it could not be tracked in a camera’s image, it was too close to a “junk” marker to be identified with certainty, or its residual value was too large.
- Point residuals This is an average of all point residuals (in user distance units) for all wand markers used for the calibration. A ray residual is defined as the shortest distance between a ray and the calculated location of the point assigned to that ray. The location of a point (marker center) is computed by finding the point that has the smallest Root Mean Squared (RMS) distance to all rays assigned to that marker. So this value is an indicator of how closely the measured ray directions for all accepted wand markers intersect, and provides a good indication of the accuracy of the calibration.
- Wand residuals The wand may be considered to be a rigid body having a much greater extent than a single marker. In certain circumstances a calibration could produce very low residuals in every location where individual wand markers are found, yet the connection between distant markers may be incorrectly characterized resulting effectively in a distorted 3D space. The Wand residual is the RMS value of all residuals (in user distance units) obtained when all markers on the wand (which is assumed to be rigid) are simultaneously fitted to their rays in each frame. Its value will always be larger than the Point residual but it should not be much greater. A much larger wand residual would indicate that the distance measurements between markers further apart than the length of the wand would probably have significant errors.
- Wand length SD This value presents the standard deviation of the distance between the two outermost markers on the wand over all frames in which the markers could be identified. It is perhaps a better indicator of the “linearity” of the calibrated volume. Again, the length units are user units.
It should be noted that the residual values are a function of the accuracy of the calibration and also the noise inherent in the camera image data. The noise comes from the discrete nature of camera sensors as well as the processing electronics and software. Using cameras with low resolution sensors, especially when imaging small markers, can be a principal source of noise and a major component of the presented residual values.
Here it should also be pointed out that a calibration with a smaller number of frames may have smaller residual values than one with a large number of frames, yet the calibration will usually be less accurate. The reason is that it is easier to fit the many camera system parameters to a smaller number of input data point because the calibration is minimizing the overall residuals of all rays. It biases the resulting calibration to produce very low residuals at the participating points at the expense of locations that are elsewhere in the volume where the residuals may be quite high.
Camera list box
This area provides some results for individual cameras, as well as letting the user select the camera whose linearity grid is to be displayed in the main graphics area.
- Rays This is the number of rays from a camera that were used for the system calibration. Low values in relation to other cameras indicate that a camera did not successfully image many wand markers and that its calibration might be suspect.
- Residual This value is the average residual (in user units) for all rays that could be used from the camera. Again, it should not be much larger than for the other cameras, and it is somewhat dependent upon the resolution of the camera’s sensor.
- % Image This shows the approximate percentage of the camera’s image area that was successfully calibrated. Any marker image falling outside the shown grid area will be ignored during tracking when this calibration is used.
Reference points box
This list box provides a report on the reference markers that were used to define the Global Coordinate System in which all marker trajectories will be expressed.
- Point # This is the reference marker number as entered in the supplied .ref file.
- Point residual This value is the RMS residual of all rays (one from each camera, for each frame) that could make a measurement on that marker. Units are user units.
- Body residual This is the RMS residual of all rays to all reference points when the reference points are treated as a rigid body whose dimensions are specified in the .ref file. It is an indication of the accuracy of the marker coordinates provided in the .ref file. If the coordinates of one or more points have large errors then they may not be identified, and cannot used in computing the transformation to the Global Coordinate System. A minimum of three non-symmetric points must be correctly identified for the transformation to be calculated. Large residuals here do not affect the calibration or tracking accuracy, but could cause the resulting marker coordinates to be rotated or translated slightly from the user’s desired coordinate system. One useful technique is to track the static markers using the calibration and then use that data to calculate their separations so that their positions in the desired Global Coordinate System can be specified more correctly.
Recommended values
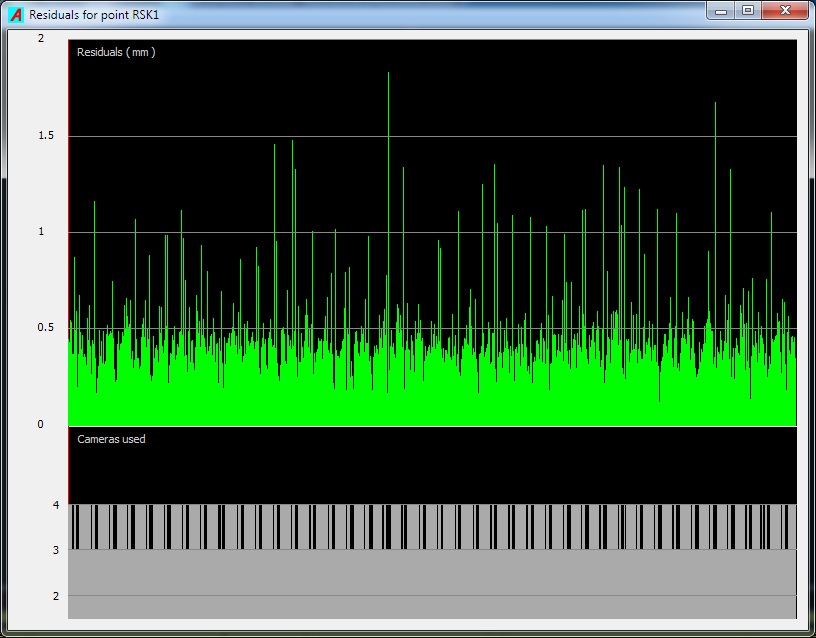
This section offers some advice on what kind of numbers are acceptable for a good and accurate calibration. Because all distance measures are in physical units the numbers will depend upon the size of the wand and the calibration volume utilized. Here we provide values for the standard 1000mm wand used in a volume of approximately 2 x 2 x 2 meters. The Identify program now provides a utility that lets you easily view the residuals and camera usage for any segment, providing a very convenient tool for checking system performance. See example output below.
- Frames and Rays used If all cameras are looking at the same part of the volume then these figures will typically be in the 80 – 95% range. If you get lower values you may want to increase the wand capture time to ensure that the program has sufficient data for the calibration. If you are calibrating an extended volume where cameras image different parts of the measurement volume then the figures will be lower.
- Standard deviations The two factors that influence these values are measurement error and noise. Measurement error results from errors in the camera parameters computed during the calibration and tend to vary over the measurement volume. They also result from the partial obscuring of markers which effectively translate their centroid positions in the camera image views. Noise effects result from the discrete nature of the camera sensors, electronic noise, and computational rounding off errors, and tend to be uniform over the measurement volume. Low resolution cameras viewing small markers will produce substantial noise which can be a major component of the standard deviation measures.
The three figures below demonstrate residual plots (from Identify) of reconstructed wand markers from three different systems.
The first figure shows the residual plot for a marker from a VGA ( 640 x 480 resolution) camera system (Optitrack V100:R2). All calibration SD values were around 0.4 – 0.6 mm. The spikes are the result of markers being partially obscured in a camera view, or marker merges in camera views.
The next figure shows an equivalent plot from a 832 x 832 pixel system (Optitrack S250e cameras) which produced calibration residuals of approximately 0.2mm.
The last plot shows results from a 5 camera 2048 x 1148 resolution system covering a considerably larger volume. In this case the SD’s were in the 0.13mm range indicating the very high accuracy that can be produced by the AMASS software.
- % image It usually should not be difficult to get these values above 70%. If they are less, then either the wand has not been moved sufficiently or the camera is not placed close enough to the measurement area. Be aware of the fact that for a marker image to be used in one camera it must, as a minimum, also appear in at least one other camera. This factor tends to complicate the cause and effect of calibration discrepancies. To be safe it is best to collect more frames with extensive wand motions to ensure that the maximum possible coverage of the camera image areas is achieved.
Control buttons
- Close Closes the ViewLin program.
- Next Closes the ViewLin program and starts calibration of the next .cen file if multiple .cen files were selected for calibration in the AMASS shell, or display the next calibration file if multiple .cal files were selected in the AMASS shell.
- Apply Writes the name of the currently displayed calibration file to the current Project file’s Track parameters, to be used for the next tracking operation.
- Delete Deletes the currently displayed calibration file.


