Table of Contents
Queried Data
The Queried Data subwindow is on the left-hand side of the application's main window. It provides the user with their first look into the CMO library and the data they have queried from it.
Note that the Queried Data subwindow will not populate until a CMO library has been loaded (![]() Load Library) and at least one query has been calculated (
Load Library) and at least one query has been calculated (![]() Group Definitions).
Group Definitions).
Groups and Workspaces
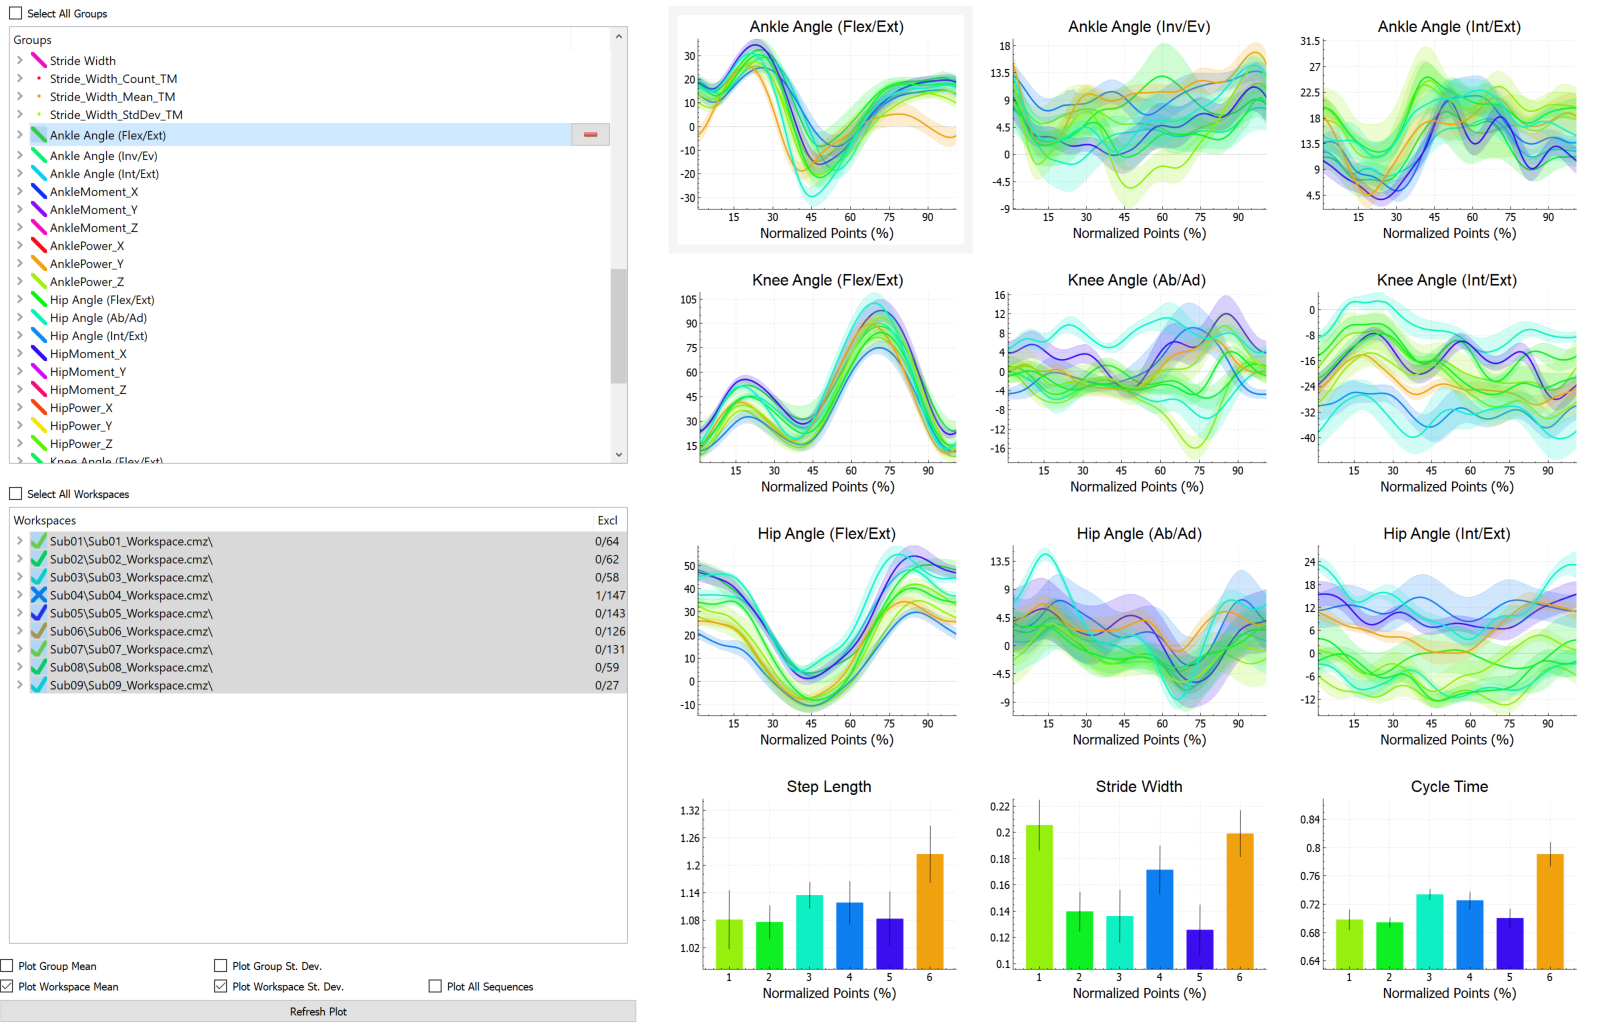
Queried Data's left panel gives users a list of calculated groups and the workspaces associated with each group.
Groups
Select a group within the Groups widget to populate the Workspace widget and show the workspaces associated with this group. Selecting a group also enables plotting group-level data on the graphs in Queried Data's right panel. It is also possible to select all groups by clicking the checkbox at the top of the Groups widget. In this case, the Workspace widget will populate with the union of all associated workspaces for all calculated groups.
Groups can be expanded to list the sub-groups (or conditions) that make up the group's definition.
Workspaces
Select a workspace within the Workspace widget to enable workspace- and trace-level plotting for the graphs in the right panel. It is also possible to select all workspaces by clicking the checkbox at the top of the Workspaces widget.
Each workspace can be expanded to show the associated .c3d files. These can be further expanded to show which frames the individual traces come from within these .c3d files. Each workspace also tracks the number of its traces that have been excluded. If all of a workspace's traces are included then its icon will be a checkmark. If any of its traces are excluded then the workspace's icon will be an X. In this case, the far-right of the workspace's row can indicate how many (or which percentage) of traces have been excluded by setting the Exclusion Display type in the ![]() Show Options dialog.
Show Options dialog.
Plotting Options
It is possible to plot group- and workspace-level means and standard deviations as well as all selected traces. Inspect3D can be set to update plots automatically (choose “Refresh plot on selection change” in the ![]() Show Options dialog) but the Refresh Plot button can be used instead.
Show Options dialog) but the Refresh Plot button can be used instead.
Graphs
The right-hand panel in Queried Data is the grid of graphs. By default there is a single graph present, i.e., a 1×1 grid of graphs, but this can be changed by choosing the number of Graph Rows and Graph Columns in the ![]() Show Options dialog. The gray bounding box around the graph let's the user know which graph is active. This is the plot that will be modified when selections are made in the left-hand panel.
Show Options dialog. The gray bounding box around the graph let's the user know which graph is active. This is the plot that will be modified when selections are made in the left-hand panel.
Right-clicking on a graphs brings up the graph's context menu, which provides a list of options to customize the graph.
Double-clicking on a graph, when it is not the only one, will either fill the screen with the graph or return to the multigraph view.

