Table of Contents
Treadmetrix Client
Contents
Overview
The Treadmetrix client is a display program for biofeedback-based training on a force treadmill.
The present software version is designed for running (i.e. not walking), particularly learning the skill elements of sprinting.
The program has five display modes, each of which appears as a tab on the main screen: forces, center of pressure, impulse, stride parameters, and a step counter. The forces and center of pressure offer strip-chart graphs, and the others are a LCD-type display. The impulse display offers information on the propulsion from each foot. The stride parameters - step frequency, stride length, and contact time - can be used to adjust the timing of the runner's gait. The step counter is mainly a convenience to a runner training for a specific distance. Each of these features is described in detail in Section 3.
All displays can be zoomed to full-screen by pressing the F8 key. Pressing the F8 key again returns to the normal window view.
Connecting
The connection of the Treadmetrix client assumes that Visual3D Server has been connected to a hardware source and is streaming data to the client. Instructions for setting up Visual3D Server are offered in the Visual3D Server documentation..
The connection of the Treadmetrix client to Visual3D Server is accomplished by clicking the mouse on the “Connect” button in the upper right-hand corner:
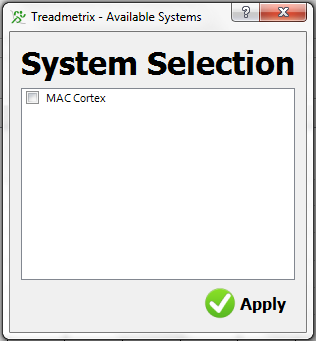
This presents a window with a list of available data streams to connect to. Typically, this will have just one option:
Click the little square box next to the hardware stream, so that it is marked, and then click the Apply button. If all goes well, the Connect button should change to have three connected chain links.
Client Interface
Ground Reaction Forces (GRF)
This tab plots the GRF in either the M-L, A-P, or vertical direction for about ten steps on a moving strip chart. In general, this tab will not be used for feedback since most human subjects will not be familiar with GRF curve shapes. Rather, this graph tab is offered primarily for troubleshooting purposes, because the operator can see that the forces are being measured correctly.
On the right side of the graph is a menu to select one of the three GRF components for plotting. The default is the vertical component.
The units of the graphs are Newtons.
Center of Pressure (CoP)
Like the GRF graph, the CoP graph is a strip chart, and it is offered primarily for troubleshooting. The menu to the right of the graph allows the user to choose between plotting the M-L, A-P, or both CoP traces.
Impulse
This tab is an LCD-type display for the propulsive impulse, i.e. the area under the A-P GRF curve for each footfall. This value is updated at each toe-off.
To the right of the LCD is a menu to select one of four different calculations to display: only the left foot, only the right foot, each foot, or the difference between the feet.
Stride Parameters
This LCD-type display offers four different parameters of interest to running coaches: stride frequency, stride length, strike index, and contact time. As with the Impulse display, the operator can choose to plot only the left foot, only the right foot, both feet, or the difference between the feet.
Step Counter
This LCD display counts footfalls (i.e. heel contacts). When the target number of steps is reached, the display turns from black to red.
The target number of steps can be changed in the user prefs windows. Similarly, the user can select whether the counter counts up or down.
User Preferences
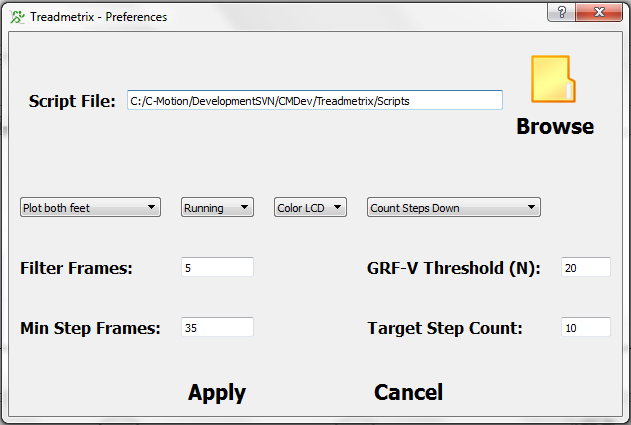
The user has many options for the display and processing of feedback data. These preferences are accessible via the “Prefs” button on the bottom row of the main window. It presents the following window:
In the middle of the window are several menus, as follows
- The ability to plot the data from the left foot, the right foot, both feet, or the difference between the feet. For example, to train a runner with asymmetry issues, the “Difference” option might be used, with the goal being to get the display to read zero.
- The ability to specify whether the athlete is running or walking. Presently, this item is inactive.
- The color of the LCD display. If “Black” is chosen, the LCD is always black. If “Color” is chosen, the LCD will be red when displaying data from a right foot (“red” and “right” both start with “r”), and blue for a left foot.
- The direction that the step counter counts steps, up or down.
Below the menus are four numerical parameters that the user can change, as follows:
- The data filter. This applies to a simple moving-average filter. The minimum value is 1 frame (i.e. no filter), and the maximum value is 200, which is many times higher than would ever be needed. The default value is 5 frames.
- The vertical threshold of the ground reaction force. That is, any GRF-V value less than this number of Newtons will be set to zero. This value is important for the determination of footfalls. If the value is too low, intrinsic vibration in the treadmill will be interpreted as human force even when the athlete is airborne. If this value is too high, the measurement of stride parameters will be inaccurate. The default value is 20 Newtons, and in general the value will be close to that - probably no less than 10 and no more than 50, although the software will allow any value from 1 to 2000.
- The minimum number of consecutive data points that would be considered a step. The acceptable values range from 1 to 2000, although in general this number should correspond to about 1/4 of a second.
- The target step count applies only to the step counter display. When counting up, the counter will turn red when it reaches this number of steps, then recycle to zero. When counting down, the counter turns red when it reaches zero, then recycles to the target number. The acceptable range is 1 to 10,000 steps.


