Table of Contents
Gait Profile Score
Overview
Baker et al. published two papers defining the calculation and applications of the Gait Profile Score (GPS)[1],[2]. The Gait Profile Score (GPS) is a clinical index that can be used to measure the overall deviation of gait data relative to normative data. It is composed of Gait Variable Scores (GVSs) calculated from 9 key kinematic gait variables, which can be presented as a Movement Analysis Profile (MAP).
These kinematic variables are:
- Knee Flexion/Extension
- Ankle Dorsiflexion/Plantarflexion
- Pelvic Tilt
- Pelvic Rotation
- Pelvic Obliquity
- Hip Flexion/Extension
- Hip Abduction/Adduction
- Hip Rotation
- Foot Progression
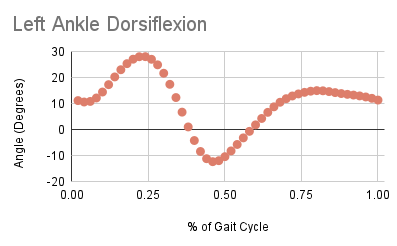
Each of these kinematic variables should be normalized to the gait cycle (as in above right image), and should be sampled every 2% of the gait cycle (such that each signal has 51 points).
The GPS score can be computed for the left and/or the right side. It can also be computed as an overall index for both sides.
Please note: Since the pelvic movement is not specific to any side, the authors recommend only including it when computing the GPS for the left side (as a convention). This means that for the left side, a total of 9 variables are used to compute the GPS, instead of only 6 for the right side. The overall GPS for both sides would therefore include all 9 variables.
Equations
Although calculating the Gait Profile Score was explained in Baker et al's 2009 paper, the equations were not explicitly written. Their 2012 paper contains explicit written equations but due to some formatting errors these are incorrect. The GPS Equations and Descriptions PDF has the correct version of these equations, which are also described below:
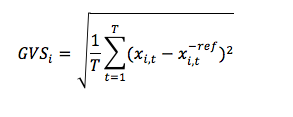
The Global Variable Scores (GVS) is the root mean square difference between a specific time normalized gait variable (x) and the mean data from the reference population calculated across the gait cycle (x ref).
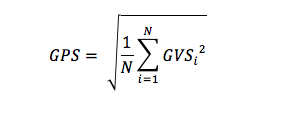
The Gait Profile Score (GPS) the root mean square average of all the Gait Variable Scores:
 | i = the specific kinematic variable T = total number of kinematic variables used If using 15 kinematic variables, N is equal to 15. |
As described in the previous section, the GPS can be calculated for the right side, the left side, or as an overall value. In Richard Baker's GPS Excel Sheet Calculator, there is also an added log transform to the final GPS value (this is optional).
GPS in Sift
Step 1: Joint Angle Definition
The joint angles for each of the nine kinematic variables need to be calculated. If kinematic variables have not been calculated for your database, visit the following tutorial for instructions and zip files for finding the kinematic measures needed for the GPS through Visual3D pipeline commands: Tutorial:_Gait_Profile_Score_and_Movement_Analysis_Profile_Pipeline
Step 2: Create a Normalized Database
To calculate GPS values a reference database needs to be created. The database should contain gait data with the same nine kinematic variables described above, which should be normalized to 51 points per gait cycle (in this tutorial, the gait cycles are defined as LHS to LHS).
Generate a VND Database in Visual3D
The steps to do so from Visual3D can be found under the Normative Data from CMZ Library page. In Visual3D and Sift, databases can be saved as .vnd file types.
Generate a Normal Database in Sift
With Sift's Build ND feature, users can generate a reference database within the Sift application. Simply load a library of CMZ files you wish to include in the ND, query the required joint angles for the GPS measure, and generate a normal database containing mean summaries at the Library level for each angle. More specifics about building a ND in Sift and how to use it are found here.
Step 3: Dialog Selections
The main GPS Dialog (left) in Sift can be accessed through the Gait Measures menu ![]() on the main toolbar. Users should begin by selecting which type of normal database file they will be using: Sift ND File or VND File. This file will be used as the reference signals when calculation the global variance scores (GVS).
on the main toolbar. Users should begin by selecting which type of normal database file they will be using: Sift ND File or VND File. This file will be used as the reference signals when calculation the global variance scores (GVS).
If using a VND file, users then should browse and selecting the normal database .vnd file that they have generated.
If using a Sift ND File, the user must select the loaded ND file from the drop down. NOTE: The Sift ND File MUST be loaded into Sift before using it for the GPS. See here for loading a Sift ND.
After selecting a ND … The signal type dialog selection will be deactivated here, as the GPS will always use LINK_MODEL_BASED signals from the underlying workspaces. The folder selection defaults to Original here, and will be used for this example. The left and right event cycles will be populated with the gait events defined in the underlying CMZ files. If this is not populated, no events were found, and those must be generated before proceeding. The literature suggests 51 normalization points for GPS signals, however, the user may change this if they wish. Here we have checked “compute query after calculation” which means that the GPS values will be auto queried into the explore page after running. We have also checked “compute individual component queries after calculation” so that groups will be queried for each GVS that makes up the total GPS score.
We then select the signal selection button to prompt a second dialog to the GPS (center). It is crucial that the user make careful selections in this dialog to ensure the correct signals are being compared. Here, users will select the signal from a list of all signals in the type and folder selected in the first dialog. Each combo box is populated with data from either the CMZ library that is loaded, or the ND file.
Pelvic Signals - The first three combo boxes under “Signals” are for the selection of the Pelvic angles. Here, we provide users with a list of all signals from the underlying CMZ workspaces and corresponding folders selected in the first dialog. Here we have chosen the “L_Pelvic_Angle” (left and right for this database example are actually the exact same signal), with components X, Y, and Z for the pelvic tilt, obliquity, and rotation angles. Sift will normalize this pelvic signal to left events for the left side GPS, and right events for the right side GPS. We then selected the left and right pelvis X, Y, and Z angles from the list of signals that Sift identified in the VND or Sift ND normal database. Here, the normal database has computed a L_Pelvic_Angle and R_Pelvic_Angle. Note that the Normal Database signals are assumed to be already normalized to gait events, and then averaged. So in this case, L_Pelvic_Angle was normalized to left side events, and R_Pelvic_Angle was normalized to right side events prior to loading in this Normal database file.
General Signals - The rest of the “Signals” options are populated with signals that Sift has found a left and right match for in the CMZ workspaces, and gives you the “general” names. For example, Sift may find a L_Hip_Angle and R_Hip_Angle in each workspace, and the user would select “Hip_Angle” as the general option. Sift only provides users with signals where both L and R are found. Sift does not look specifically for matches in the ND files, because again, it is assumed that these signals have already been normalized to left and right gait events. Make sure you select the correct L and R signals for each entry of the dialog.
Once we return to the main dialog (right), the compute button is now active, and we can calculate the GPS and individual GVS measures for the active CMZ files against the normal database.

Step 4: Calculate and View Results
GPS calculations are saved as metrics in the CMZ workspaces loaded in Sift. When queried into the explore page, users may plot them as Metric or Metric-Metric plots. Here, we can see the total GPS scores generated for selected workspaces plotted as a metric bar chart. We can also look at right and left specific GPS scores from the conditions of group GPS_1.
References
- [1] Baker, R., McGinley, J.L., Schwartz, M.H., Beynon, S., Rozumalski, A., Graham, H.K., Tirosh, O. (2009). The gait profile score and movement analysis profile. Gait Posture, 30(3), 265–269.
- [2] Baker, R., McGinley, J. L., Schwartz, M., Thomason, P., Rodda, J., & Graham, H. K. (2012). The minimal clinically important difference for the Gait Profile Score. Gait Posture, 35(4), 612-615.
Relevant Links


