Table of Contents
Example - Identify Events at Local Max
The goal in this example is to identify Events at the local maximum values of the following signal, but only within a specified range.
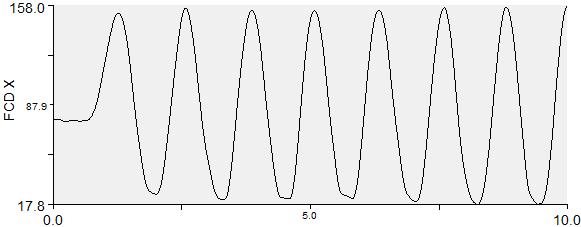
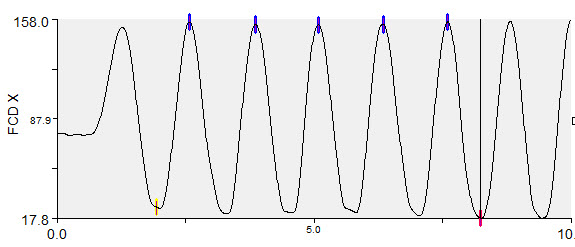
Consider the following signal:
Switch to Signal and Events mode.
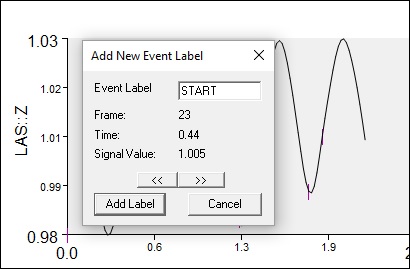
Create a START Event manually
To create an event manually, double click on the graph at the point where the specified range should be begin and add an “Event Label”.
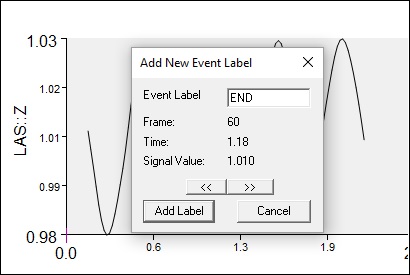
Create a END Event manually
To create the END event manually, similarly double click on the point on the graph where the end of the specified range is and add a label.
Compute All Maxima
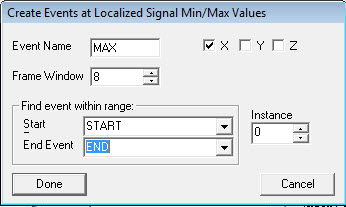
Now modify the Event_Maximum pipeline command to compute all maxima of the x-component of the signal FCD within the range defined by the START event and END event.
Event_Maximum
/SIGNAL_TYPES=LINK_MODEL_BASED
/SIGNAL_NAMES=FCD
! /SIGNAL_FOLDER=ORIGINAL
/EVENT_NAME=MAX
/SELECT_X=TRUE
/SELECT_Y=FALSE
! /SELECT_Z=FALSE
! /FRAME_WINDOW=8
/START_AT_EVENT=START
/END_AT_EVENT=END
/EVENT_INSTANCE=0
;
Note that the Event_Instance=0 means that all instances are identified in this range.
Result
Seen in the figure below, the yellow and red marks represent the START and END events with the purple marks showing all the local maximum values between the START and END events.

