visual3d:documentation:pipeline:other_commands:real_time_commands
Real Time Commands
| Load_RT_Pipeline |
| Load the RealTime Processing Pipeline. Include the FULL pathname for the file. This pipeline is executed every time Visual3D grabs a frame of streaming data Load_RT_Pipeline /FILE_NAME= ; Specify the entire path to the file. |
| Load_RT_Graph_Pipeline |
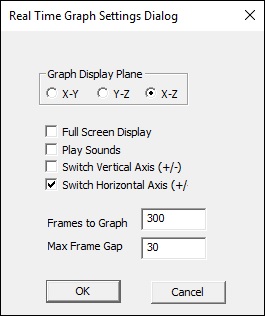
| Load the Real Time Biofeedback graph pipeline. Specify the full pathname to the file Load_RT_Graph_Pipeline /FILE_NAME=::RT_GRAPHS ! /FULL_SCREEN_DISPLAY=FALSE ; |
| Load_RT_Plugin |
| Load the manufacturer specific Real Time plugin (e.g dll) Visual3D looks for the dll in the Plugins Directory Load_RT_Plugin /PLUGIN_NAME= ; |
RT and Post Processing Biofeedback
| Animated_Sphere |
| Animated_Sphere /SIGNAL_TYPES= ! /SIGNAL_FOLDER=ORIGINAL /SIGNAL_NAMES= ! /COLOR_RED=1.0 ! /COLOR_GREEN=1.0 ! /COLOR_BLUE=1.0 ! /RADIUS=0.02 ; Example: draw a red sphere on the Right Thigh Markers(RTH1, RTH2, RTH3, RTH4) Animated_Sphere /SIGNAL_TYPES=TARGET /SIGNAL_FOLDER=ORIGINAL /SIGNAL_NAMES=RTH1+RTH2+RTH3+RTH4 /COLOR_RED=1.0 /COLOR_GREEN=0 /COLOR_BLUE=0 /RADIUS=0.02 ; |
| Animated_Line |
| Animated_Line /SIGNAL_TYPES= /SIGNAL_FOLDER= /SIGNAL_NAMES= ! /LINE_WIDTH=2.0 ! /LINE_COLOR_RED=1.0 ! /LINE_COLOR_GREEN=1.0 ! /LINE_COLOR_BLUE=1.0 ! /DRAW_AS_CYLINDER=FALSE ; Example: draw a red cylinder between the markers on the Right Thigh (RTH1, RTH2, RTH3, RTH4) Animated_Line /SIGNAL_TYPES=TARGET /SIGNAL_FOLDER=ORIGINAL /SIGNAL_NAMES=RTH1+RTH2+RTH3+RTH4 /LINE_WIDTH=2.0 /LINE_COLOR_RED=1.0 /LINE_COLOR_GREEN=0 /LINE_COLOR_BLUE=0 /DRAW_AS_CYLINDER=TRUE ; |
visual3d/documentation/pipeline/other_commands/real_time_commands.txt · Last modified: 2024/07/17 15:46 by sgranger


