Table of Contents
Add Graph Annotation
Overview
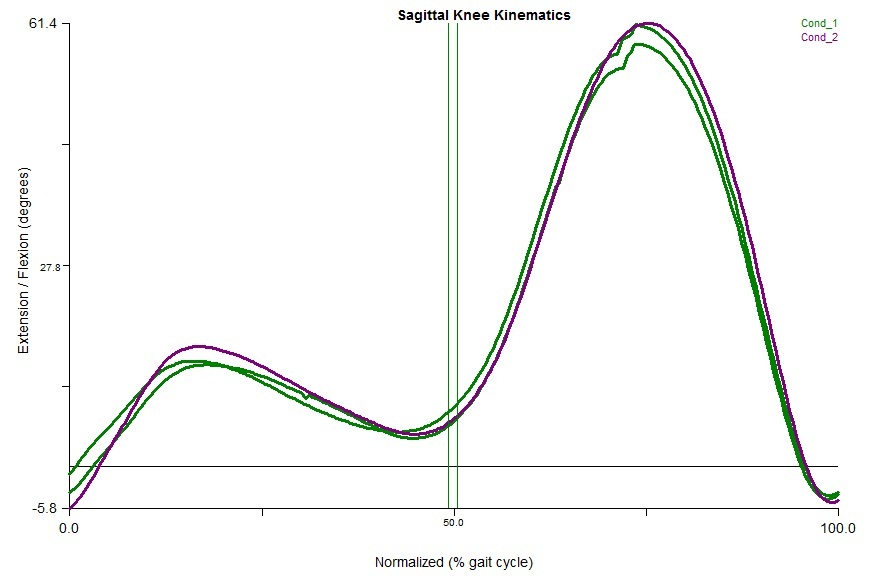
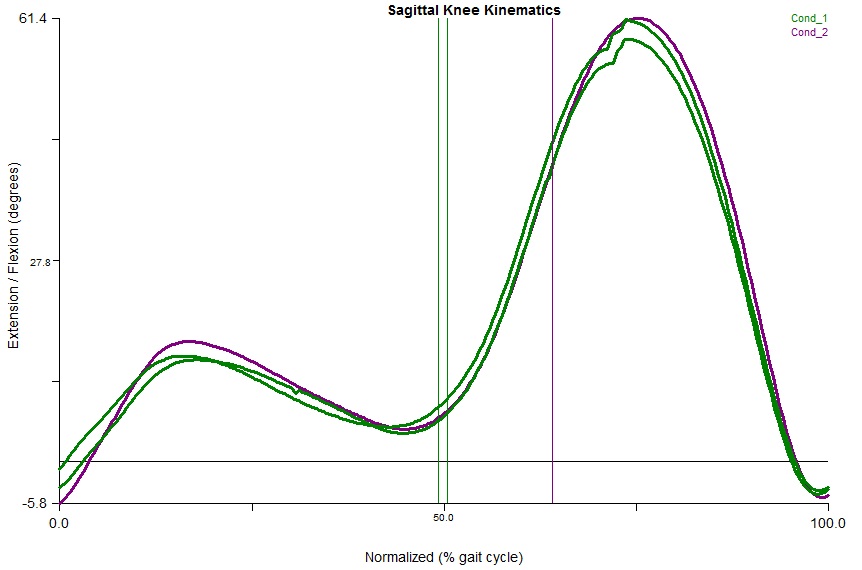
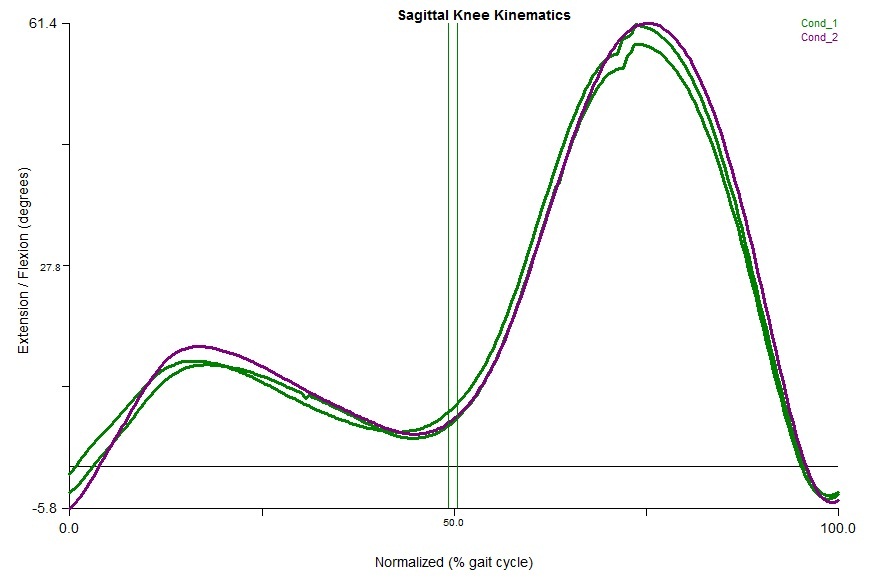
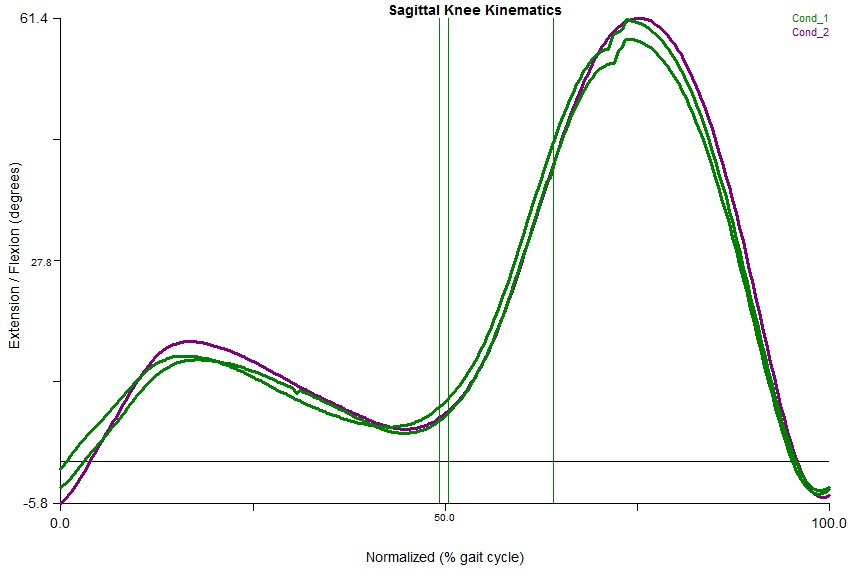
Graph annotations, which can be manually modified by using the annotations button on the Add/Modify Graph pop up dialog, can also be added using the Add_Graph_Annotation pipeline command.
Annotations like setting the graph title, changing graph properties such as line colour/ line style and size can be done using this pipeline command.
Pipeline Command
Add_Graph_Annotation
  /PAGE_NUMBER=
  /COLUMN_NUMBER=
  /ROW_NUMBER=
  /DRAW_ORDER=
  /ANNOTATION_EVENT=
! /ANNOTATION_STYLE=Ticks
! /ANNOTATION_COLOR=Red
! /ANNOTATION_SIZE=Normal
! /ANNOTATION_GLOBAL=False
! /ANNOTATION_AVERAGE_EVENT=False
;
Command Parameters
The Page_Number, Column_Number, and Row_Number parameters are used to specify the location of the graph to be modified by the command.
Draw Order
Draw order indicates which graph will be annotated. The first graph that was drawn will be drawn first. By default the graphs are drawn in the order they are created. It is possible to check which graph was drawn first, two methods can be found here.
Modifying the DRAW_ORDER is similar to using the “Set annotation local” radial box when manually adding an annotation.
Annotation Event
The event times at which a symbol should be drawn. If Annotation_Average_Event is true, the edit box has two meanings:
- a number indicating the percent of the range
- an event label, such that the event labels in all graphs are added
The following options are available:
| Annotation_Style | Annotation_Color | Annotation Size |
|---|---|---|
| TICKS | Black | Normal |
| Top TICKS | Blue | Small |
| Bottom TICKS | Cyan | Large |
| Vertical Line | Green | |
| Box | Purple | |
| Triangle | Red | |
| Cross | Yellow | |
| Up Arrow | ||
| Down Arrow |
Annotation Global
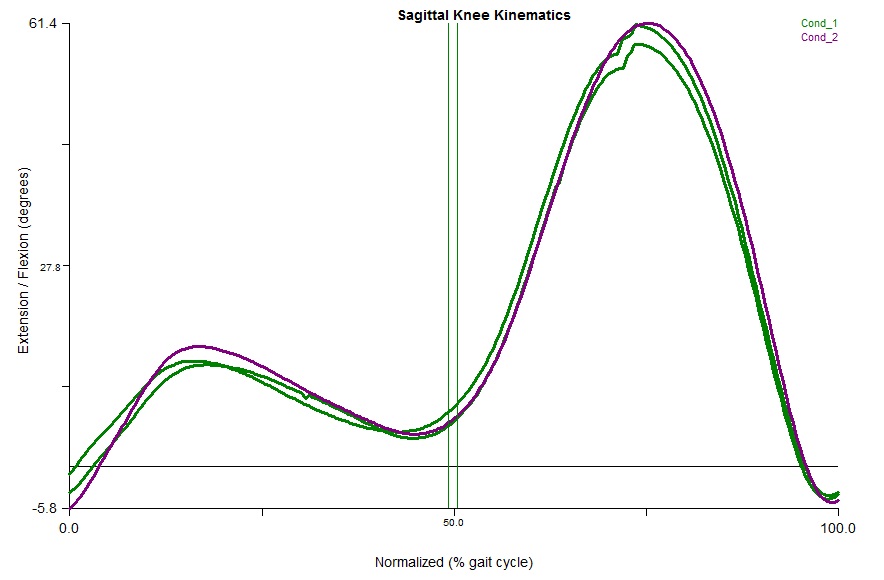
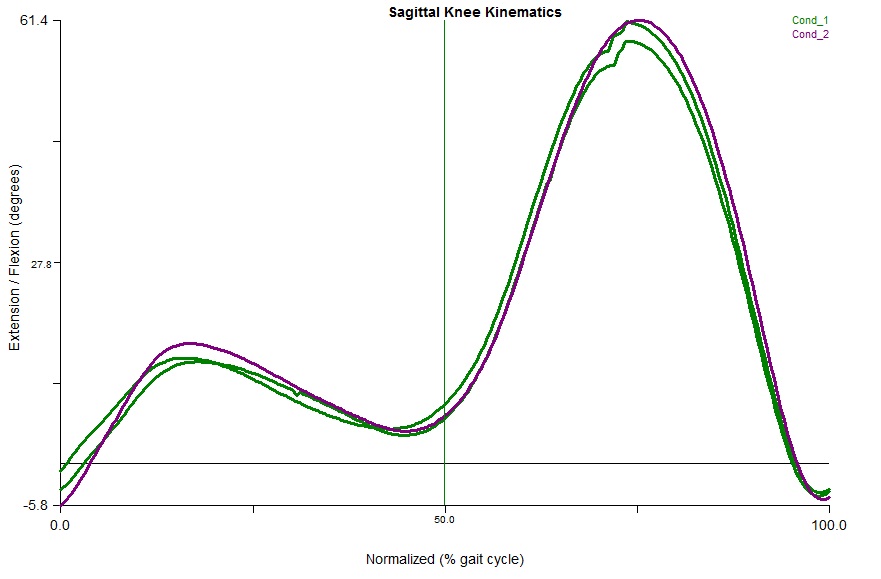
When set to FALSE will add graph annotation to only the graphs at the specified location and on a specific line on the graph (for example row 1 column 1) based on the DRAW_ORDER.
When set to TRUE will add graph annotation to the graph at the DRAW_ORDER but find the ANOTATION_EVENT on all lines on specified on the graph (for example, at row 1, column 1).
Modifying the ANNOTATION_GLOBAL is similar to using the “Set annotation globally” radial box when manually adding an annotation.
Annotation Average Event
When set to FALSE, all instances of the event will be displayed.
When set to TRUE, all instances of the event will be averaged, and only the average event will be displayed.
Modifying the ANNOTATION_AVERAGE_EVENT is similar to using the “All Graphs” or “Average Event or Numeric Value” radial box when manually adding an annotation.
Dialog
See Also
It is also possible to add free-form text annotations to reports. Or go back to the Report Commands Overview.

