Table of Contents
Make Text Annotation
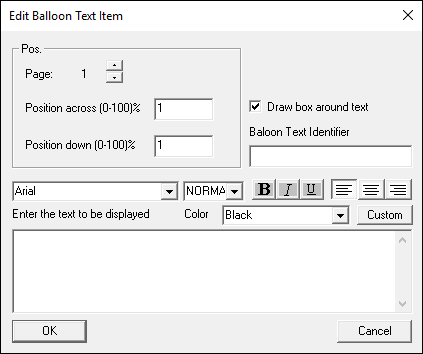
It is possible to add a box to the report graph containing freeform text to provide context or to annotate the report.
Pipeline Command
Make_Text_Annotation
/ANNOTATION_NAME=TEXT1
/PAGE_NUMBER=1
/X_POS=1
Y_POS=1
/BALLOON_TEXT=Help
! /TEXT_SIZE=NORMAL
;
Notes
This is an interim solution, meaning the user has no control over the size of the box, or the lines/shadows around the box. The graph item does not appear in the combo box to add a new graph, but does appear in the report dialog if the command is executed. Changes to the text must be made via the pipeline command but the graph item can only be deleted from this dialog.
For specifying the annotation's location: the top left of the page is location (1,1) while the bottom right of the page is location (100,100) expressed in percentage of page width/height respectively.
See Also
It is also possible to add graphical annotations to reports. Or go back to the Report Commands Overview.

