Table of Contents
Modify Line Graph
Command
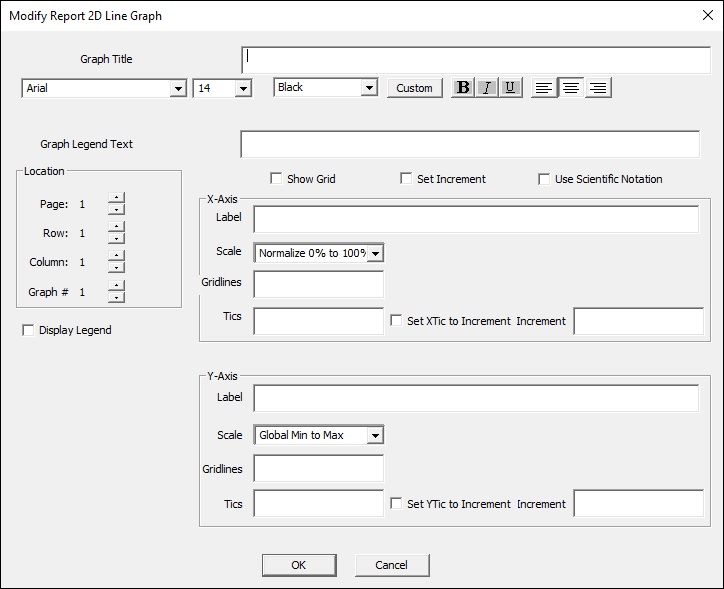
Modify a line graph in the report
Scale = Normalize 0% to 100%, Global Min to Max, or By explicit setting
Modify_Line_Graph
/PAGE_NUMBER=1
/COLUMN_NUMBER=1
/ROW_NUMBER=1
/GRAPH_NUMBER=1
! /GRAPH_TITLE=
/GRAPH_TITLE_FONT=Arial
/GRAPH_TITLE_FONT_SIZE=14
! /GRAPH_TITLE_FONT_BOLD=FALSE
! /GRAPH_TITLE_FONT_ITALIC=FALSE
! /GRAPH_TITLE_FONT_UNDERLINE=FALSE
! /GRAPH_TITLE_ALIGN=ALIGN_CENTER
! /GRAPH_TITLE_VERTICAL_ALIGN=ALIGN_TOP
/GRAPH_TITLE_COLOR=Black
! /GRAPH_LEGEND_TEXT=
/DISPLAY_LEGEND=FALSE
! /DISPLAY_LEGEND_FOLDER=
! /DISPLAY_LEGEND_SIGNAL=
! /DISPLAY_LEGEND_TAG=
! /DISPLAY_LEGEND_LINE=
! /DISPLAY_LEGEND_TEXT=
! /X_AXIS_LABEL=
! /X_AXIS_SCALE=Normalize 0% to 100%
! /X_AXIS_MIN=
! /X_AXIS_MAX=
! /Y_AXIS_LABEL=
! /Y_AXIS_SCALE=Global Min to Max
! /Y_AXIS_MIN=
! /Y_AXIS_MAX=
! /Y_USE_SCIENTIFIC_NOTATION=FALSE
;
Parameters
Tics
You can either: Specify the number of tics you want to see on the X and Y axes - OR - Specify the number of tics to match the Increment Values
So if you Set XTic to Increment to TRUE, and X Increment is set to 5 - there will be a tic every 5 values. If you Set XTic to Increment to FALSE, and X Tics is set to 5 - there will be 5 tics on the x axis.
Set Increment
Rounds Values to the nearest increment (ex. Y Axis label will be rounded from 39.2 to 40 if set to 10)
So, if Set Increment is set to TRUE, and Y Increment is set to:
- 1, the Y axis labels will be rounded to the nearest whole number
- 5, the Y axis labels will be rounded to the nearest 5
- 10, the Y axis labels will be rounded to the nearest 10
GRAPH_TITLE_VERTICAL_ALIGN
Possible inputs: ALIGN_TOP | ALIGN_MIDDLE | ALIGN_BOTTOM

