visual3d:documentation:reports:2d_horizontal_bar
Table of Contents
2D Horizontal Bar
Draw horizontal bars on a Report Graph
This is especially useful for creating ON/OFF bars for EMG data. An example of creating a simple horizontal line is provided after this example.
| This example creates a line that is ON/OFF to express when an EMG signal is expected to be ON/OFF through the gait cycle (red line in picture on right): | 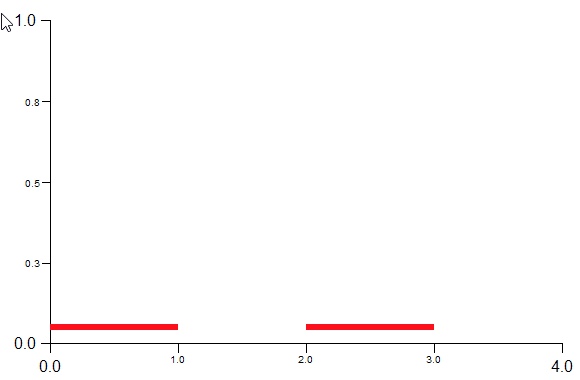 |
As a simple example, create a P2D signal representing the frames and ON/OFF values
! make the GLOBAL workspace active

Select_Active_File
/FILE_NAME=GLOBAL
! /QUERY=
;

! create a signal of ON/OFF values

Evaluate_Expression
/EXPRESSION=LIST(VECTOR(0,1),VECTOR(1,0),VECTOR(2,1),VECTOR(3,0),VECTOR(4,1))
/RESULT_TYPES=P2D
/RESULT_FOLDERS=BARS
/RESULT_NAME=BAR1
! /APPLY_AS_SUFFIX_TO_SIGNAL_NAME=FALSE
;
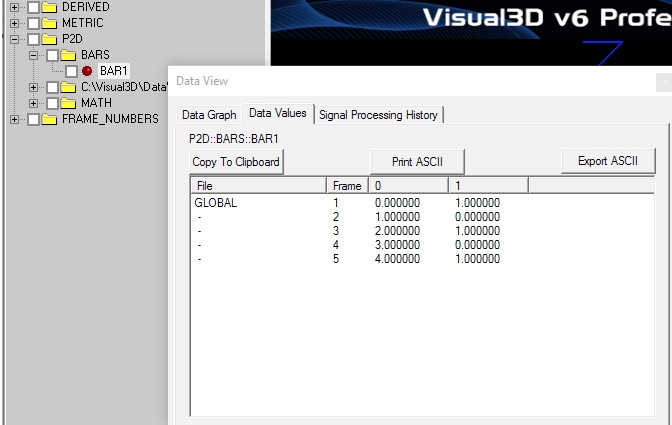
The resulting signal is:
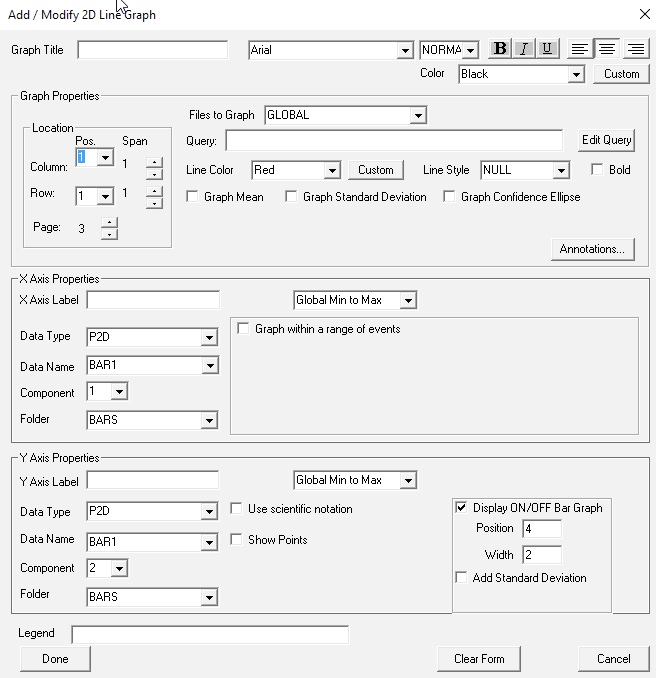
Create a Report 2D Graph:
Simple Horizontal Line
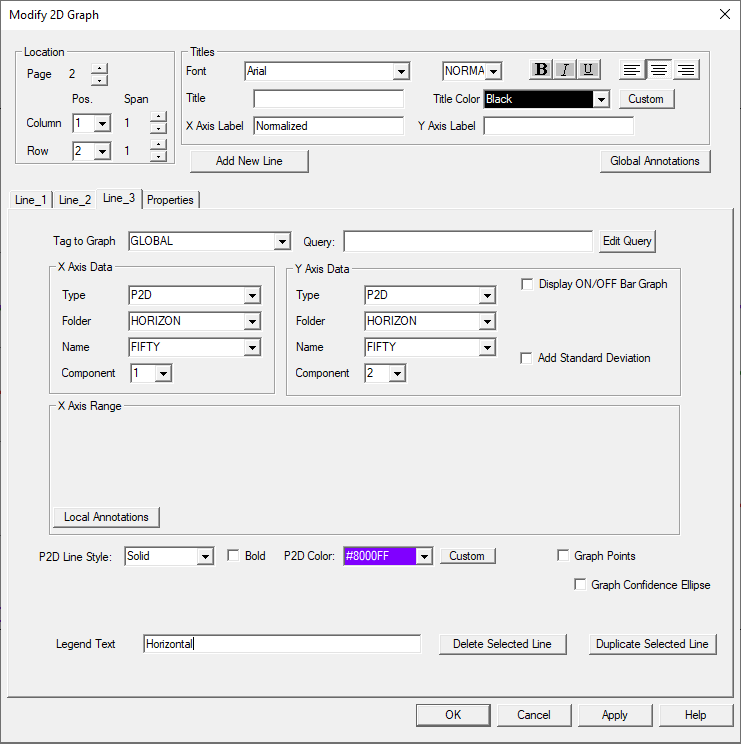
| This example is to create a simple horizontal line straight across using P2D signals (purple line in graph on right): | 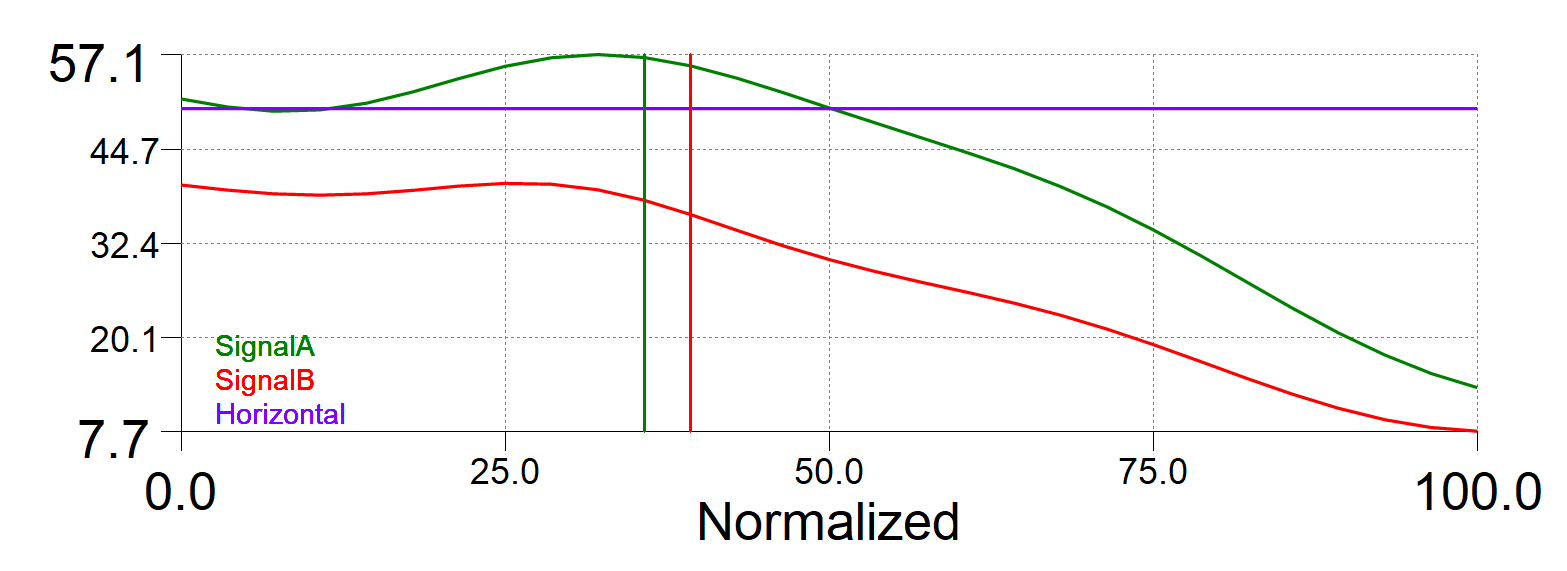 |
Create the horizontal line as a P2D signal:
Evaluate_Expression
/EXPRESSION=
 LIST (
  VECTOR(1,50) ,
  VECTOR(101,50) )
! /SIGNAL_TYPES=
! /SIGNAL_FOLDER=ORIGINAL
! /SIGNAL_NAMES=
 /RESULT_TYPES=P2D
 /RESULT_FOLDERS=HORIZON
/RESULT_NAME=GLOBAL::FIFTY
! /APPLY_AS_SUFFIX_TO_SIGNAL_NAME=FALSE
;
visual3d/documentation/reports/2d_horizontal_bar.txt · Last modified: 2024/07/17 15:46 by sgranger

