visual3d:documentation:reports:changing_the_color_of_lines_in_graphs
Changing the color of lines in graphs
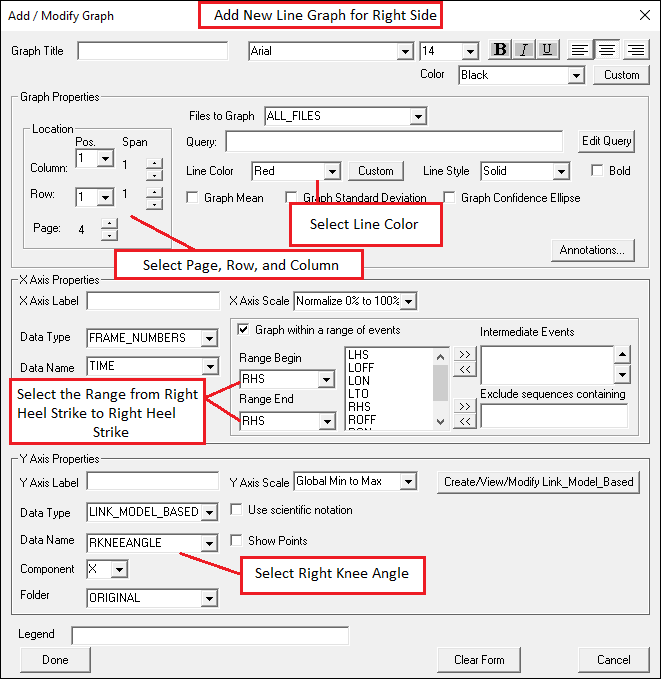
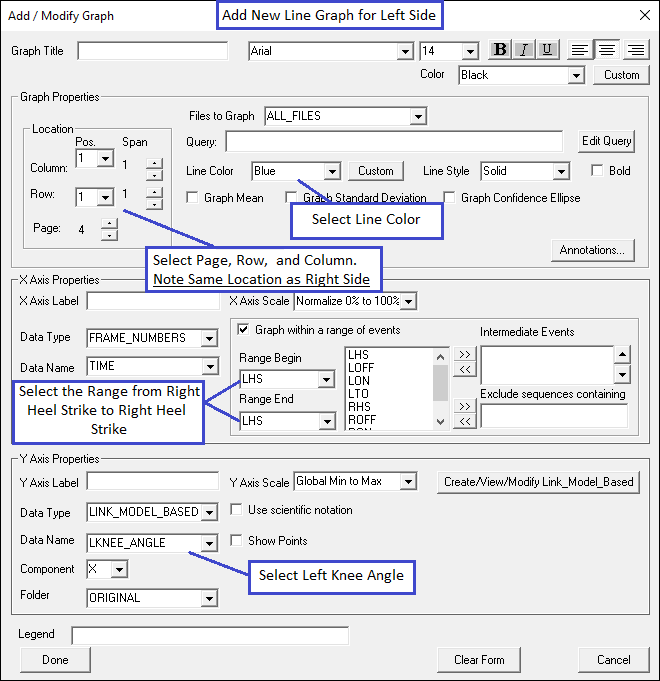
The following steps will allow you to draw two signals at the same location.
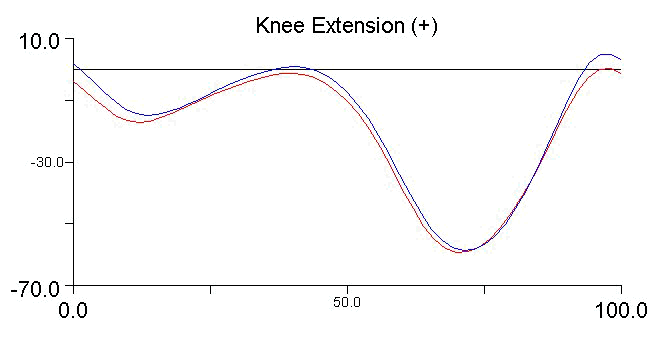
Both the right and left knee flexion angle are drawn on the same graph. The right knee angle is drawn in red and the left knee angle is drawn in blue.
visual3d/documentation/reports/changing_the_color_of_lines_in_graphs.txt · Last modified: 2024/07/17 15:46 by sgranger


