Table of Contents
Scripting Report Templates
Scripting Report Templates
Introduction
Report templates may also be created using the Make_Line_Graph pipeline command. In conjunction with the Make_Line_Graph command, For_Each loops can be used to create a report template in a few steps. Before creating a Report Template from a script, it is important to understand that the RECALC pipeline (which saves the COMPUTE_MODEL_BASED_DATA commands) is also saved in the .rgt file (the report template file).
NOTE: Using this method requires a prior knowledge of writing pipeline scripts, and it is suggested to complete the pipeline tutorials prior to testing this method.
Download
You may download the sample reporting script and sample data files here.
The entire script may also be seen here.
Using the Script
Naming Convention
This example is meant to serve as a starting point for others to work off. The sample script will create a report template for signals following this naming convention:
RAnkleAngle + LAnkleAngle + LAnkleMoment + RAnkleMoment
As with any scripting language, consistency is key. The following example works because R and L are used to indicate the right/left sides. There are several other parameters that are based on the letters R and L.
The signal names are indicated based on R/L
The events are plotted based on the side (R/L) and the event HS (or ON)
The graph colors are based on the side (R/L)
If the user would like to use Right/Left instead of R/L, these parameters will need to be changed throughout the entire script.
The benefit to using a script such as the following, is that the color may be changed by modifying the parameters “COLOR_R” and “COLOR_L”. Although since these are specified using a conditional statement, the color must be specified using HEX and only the number values may be used (no letters). This is explained in more detail in the comment lines of the pipeline script.
Example 1: Kinematics
To plot kinematics, the signals LAnkleAngle, RAnkleAngle, LKneeAngle, RKneeAngle, LHipAngle, and RHipAngle will be plotted in the report template starting at page 1. Each Joint (Ankle, Knee and Hip) will be graphed on a new page, and each side (L/R) will be plotted in separate columns using different colors. The signals will be normalized as a percent of the gait cycle (HS to HS).
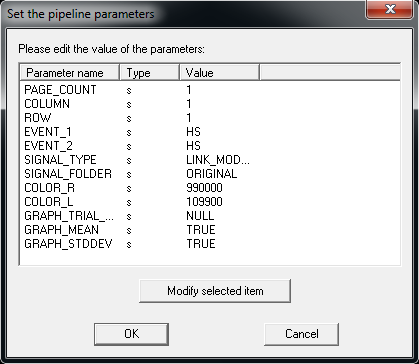
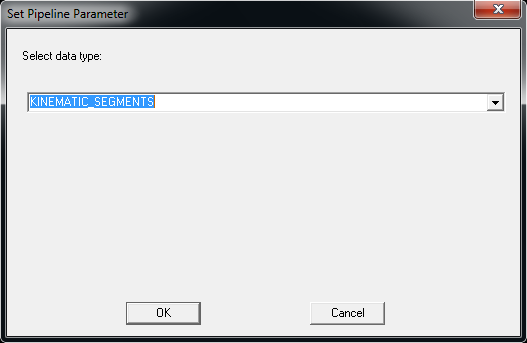
Parameters such as line color and event sequence must be specified in the first command of the script. For kinematic signals, generally the user would start at page 1 and plot between HS to HS. The user will then need to indicate kinematic signals are being plotted in the next prompt. The signals associated with the KINEMATIC_SEGMENTS parameter will be assigned to the DATA_NAME_LIST parameter and each signal in the list will be plotted.
The following commands will prompt the user (images of prompt below):
Prompt_For_Multiple_Pipeline_Parameter_Values
/PIPELINE_PARAMETER_NAME=PAGE_COUNT+COLUMN+ROW+EVENT_1+EVENT_2
 +SIGNAL_TYPE+SIGNAL_FOLDER+COLOR_R+COLOR_L
 +GRAPH_TRIAL_STYLE+GRAPH_MEAN+GRAPH_STDDEV
/DATATYPE=s+s+s+s+s+s+s+s+s+s+s+s
/DEFAULT_VALUE=1+1+1+HS+HS+LINK_MODEL_BASED+ORIGINAL+990000+109900+NULL+TRUE+TRUE
;

Set_Pipeline_Parameter
! List of signals that will be graphed
!  The SIDE parameter will specify whether the signal is L or R
/PARAMETER_NAME=DATA_NAME_LIST
/PARAMETER_VALUE=AnkleAngle+KneeAngle+HipAngle
;

Set_Pipeline_Parameter
! List of signals that will be graphed
!  The SIDE parameter will specify whether the signal is L or R
/PARAMETER_NAME=DATA_NAME_LIST
/PARAMETER_VALUE=&:&:&::SEGMENT_TYPE
/MULTI_PASS=TRUE
;
The previous commands prompt the user for the graph parameters and the signals to be graphed:
Example 2: Kinetics
To plot kinetics, the signals LAnkleMoment, RAnkleMoment, LKneeMoment, RKneeMoment, LHipMoment, RHipMoment, LAnklePower, RAnklePower, LKneePower, RKneePower, LHipPower, and RHipPower will be plotted in the report template starting at page 4. Each Joint (Ankle, Knee and Hip) will be graphed on a new page, and each side (L/R) will be plotted in separate columns using different colors. The signals will be normalized as a percent of the gait cycle (ON to HS).
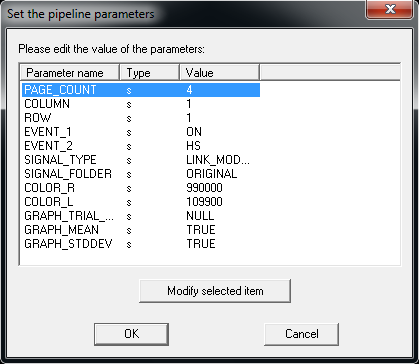
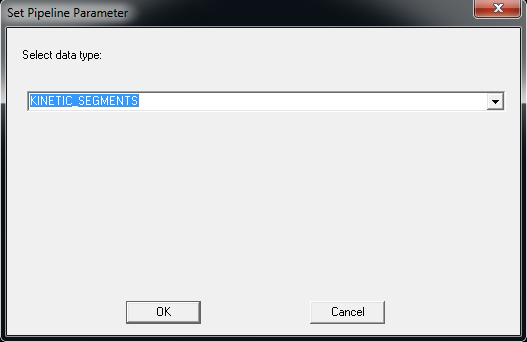
Parameters such as line color and event sequence must be specified in the first command of the script. For kinetic signals, generally the user would start after the last page of kinematics and plot between ON to HS. The user will then need to indicate kinetic signals are being plotted in the next prompt. The signals associated with the KINEMATIC_SEGMENTS parameter will be assigned to the DATA_NAME_LIST parameter and each signal in the list will be plotted.
The following commands will prompt the user (images of prompt below):
Prompt_For_Multiple_Pipeline_Parameter_Values
/PIPELINE_PARAMETER_NAME=PAGE_COUNT+COLUMN+ROW+EVENT_1+EVENT_2
 +SIGNAL_TYPE+SIGNAL_FOLDER+COLOR_R+COLOR_L
 +GRAPH_TRIAL_STYLE+GRAPH_MEAN+GRAPH_STDDEV
/DATATYPE=s+s+s+s+s+s+s+s+s+s+s+s
/DEFAULT_VALUE=4+1+1+ON+HS+LINK_MODEL_BASED+ORIGINAL+990000+109900+NULL+TRUE+TRUE
;

Set_Pipeline_Parameter
! List of signals that will be graphed
!  The SIDE parameter will specify whether the signal is L or R
/PARAMETER_NAME=DATA_NAME_LIST
/PARAMETER_VALUE=AnkleMoment + KneeMoment + HipMoment + AnklePower + KneePower + HipPower
;

Set_Pipeline_Parameter
! List of signals that will be graphed
!  The SIDE parameter will specify whether the signal is L or R
/PARAMETER_NAME=DATA_NAME_LIST
/PARAMETER_VALUE=&:&:&::SEGMENT_TYPE
/MULTI_PASS=TRUE
;
The previous commands prompt the user for the graph parameters and the signals to be graphed:


