Table of Contents
Data Tree
The data tree presents a hierarchical view of your experimental data, similar to the files-and-folders hierarchy seen on most computer operating systems. Wherever you see a file-folder icon ![]() you can click once with the left mouse button on the small box containing a plus sign (+) to its left to expand it and see what the folder contains, e.g.
you can click once with the left mouse button on the small box containing a plus sign (+) to its left to expand it and see what the folder contains, e.g.
The black-outlined square box  next to each data item is a checkbox (click once with the left mouse button and it becomes
  ) which allows you to select that item as input to the pipeline (see below). Note that selecting a folder automatically selects all the individual items in that folder. Every item in the data tree has a name, also referred to as its label.
Data Types
In the Visual3D Data Tree, the highest level folders represent the signal or data type (example TARGET, ANALOG, or FORCE). Here we will describe each data type and what the data represents.
| Data Type | Description |
|---|---|
| TARGET | The TARGET data folder contains the POINT signals (MoCap markers) stored in the c3d file. Specifications on c3d data type and format can be found here. |
| ANALOG | The ORIGINAL folder for ANALOG data include the raw signals stored in the c3d file. These can include force, moments, or EMG signals. |
| FORCE, COFP, FREEMOMENT | The Force, Centre of Pressure and Free Moment signals (Force Platform Signals) are computed from the ANALOG signals and the FORCE_PLATFORM parameters in the c3d file. These signals can be modified by changing the C3D Force Platform parameters, or by processing the ANALOG signals. |
| KINETIC_KINEMATIC | The KINEMATIC_KINETIC folder contains a sub-folder of each segment created in the model that contains the kinetic and kinematic data resolved in the Laboratory Coordinate System. These signals exist for reference; they cannot be processed or included in a Report Graph. The LINK_MODEL_BASED items use this data to create the LINK_MODEL_BASED signals. |
| LINK_MODEL_BASED | LINK_MODEL_BASED data is populated with signals produced by the model-based items defined by the user through the graphical interface or from the Compute_Model_Based_Data pipeline command. |
| DERIVED | The DERIVED folders contain signals that can not be directly associated with the data that was originally captured. It contains the result of processing one or more signals, for example, taking the average of two signals. Specifications on derived data type and format can be found. |
| EVENT LABELS | These folders contain all of the defined events stored in the C3D file, or any Event Labels that the user has created or modified. |
| METRIC | The METRIC data type contains metric values, which are discrete quantitative values computed through pipeline commands that do not have a time-base like other signals. |
| PARAMETERS | The PARAMETERS data type contains data that defines the data collection process (e.g., the number of analog channels, the sampling rate, scaling factors). This folder also specifies the location of the data (and type of data) within the file, and sometimes contains isolated annotations. More information on parameters in c3d data structures is found here. |
| HEADER INFORMATION | The HEADER INFORMATION data type contains a summary of the data storage, including pointers to the start of the Parameter and Data blocks. More information on header information data types and formatting in c3d files can be found here. |
Data Folders
The middle layer of the hierarchy allows for data within a particular data type to be organized into folders. There are two special folders for most data types: ORIGINAL and PROCESSED.
ORIGINAL and PROCESSED Data
In the Visual3D Data Tree, the highest level folders represent the signal or data type (example TARGET, ANALOG, or FORCE). Within these, there are ORIGINAL and PROCESSED folders. These folder names are occupied by Visual3D, and replicas cannot be created by the user.
ORIGINAL folders typically contain data read from the c3d file. Visual3D can also compute new signals from existing signals; smoothing to filter out noise is a typical example. New signals always go into a new folder, initially named PROCESSED, which is a sibling of the folder containing the signal from which the new one was derived (i.e., the new folder sits at the same level in the data hierarchy). By default when a signal is processed in Visual3D, the resulting signal is stored in the PROCESSED folder. Note that by default this will over-write and existing signals of the same name in the PROCESSED folder.
Many pipeline commands, however, will allow you to select the output folder for the PROCESSED signals.
Parameters, Signals, and Metrics
At the bottom level of the hierarchy are parameters, signals and metrics.
Signals
Signals are data items recorded over time by your motion-capture or data-acquisition system. Mathematically, signals are discretely sampled functions whose independent variable is time.
Signals may be scalar-valued (e.g., a single voltage output by a strain gauge) or vector-valued (e.g., (x,y,z) coordinates of a target marker).
Parameters
Parameters are individual metadata items from a C3D file, which may be as simple as a single number or as complex as a list of names. In contrast, parameters and metrics are discrete data which do not vary as a function of time or any other variable.
Metrics
Metrics are quantities computed by Visual3D which in some way collapse the time dimension of signals (e.g., average value of a signal over a duration) or the spatial dimension of models (e.g., center of mass of entire model). The main distinction between parameters and metrics is that parameters are stored in the c3d file parameter section, whereas metrics are computed by Visual3D.
Different types of data are represented by distinctive icons in the data tree.
Syntax
Signals, metrics and parameters can all be referenced in pipeline commands and expressions using the TYPE::FOLDER::NAME syntax.
Example: Link Model Based
If the LINK_MODEL_BASED signal is processed, the result is placed in the PROCESSED folder. Visual3D remembers how to build the ORIGINAL LINKMODEL_BASED_SIGNALS but has not kept complete track of the processing of the LINK_MODEL_BASED signals, so the PROCESSED LINKMODEL_BASED_SIGNALs must be reprocessed every time the LINK_MODEL is changed. This is a subtle control from HAS-Motion because we don't believe that the LINKMODEL_BASED_SIGNALs should be processed, just to make the signals look good.
If the user has elected to use PROCESSED data to create the LINK_MODEL_BASED items or if the user has elected not to use PROCESSED data to create the LINK_MODEL_BASED items the resulting signal is in the ORIGINAL folder.
Data Management
Context Menus
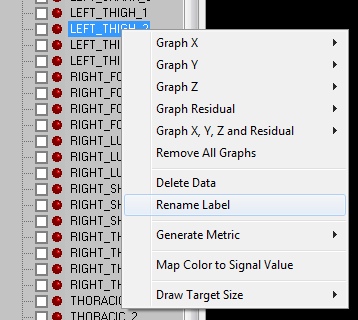
Clicking the right mouse button in the data tree will bring up a different context menu depending on the type of data selected. The following context menus are available from the data tree:
EVENT_LABEL
- Highlight a label on the 2D graphs
- Rename a label
- Delete a label
TARGET, GRFORCE, COFP, FREEMOMENT
- Graph the X component of a signal
- Graph the Y component of a signal
- Graph the Z component of a signal
- Graph X, Y and Z components of a signal
- Remove all graphs
- View signal processing history
ANALOG
- Graph the signal
- Remove all graphs
- View signal processing history
- Viewing Data
Checkboxes
The checkboxes next to each signal areused for signal and event processing. The processes specified in the “Process Signals” or “Process Events” dialog will be performed on the checked signals in the data tree.
Quick Processing
For example, if you want to interpolate and lowpass filter all TARGETs in all files, you would:
Bring up the "Process Signals" dialog
Add an Interpolate, and a Lowpass Filter process to the "Signal Processing" list.
Set the files pulldown to "All Files"
Check the ORIGINAL checkbox under TARGET (All signals are selected).
Click the "Process" button in the "Process Signals" Dialog
Now all the TARGETs should be interpolated and filtered.
This creates a "PROCESSED" hierarchy under TARGET for the newly processed target data.
Quickly View Data
Visual3D has several tools to help you view your data. Data View is one of them.
Clicking the left mouse button on a signal will bring up a “Quick View” window for quickly viewing the signals. Clicking the left mouse button on a parameter will bring up a dialog box to view the parameter data.
You can use the Data View to:
- Display the raw data for a signal.
- Display the graphs for a signals.
- View the processing history of a signal.
- Export a single signal file to an ASCII file.
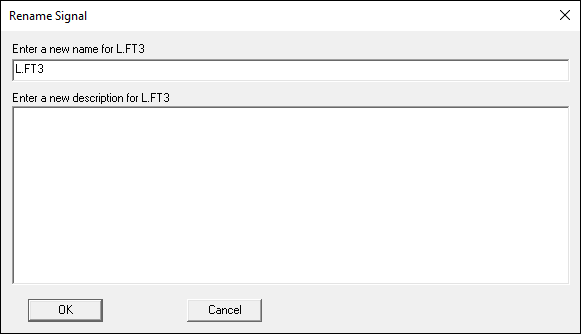
Renaming a Signal
A right mouse click on a signal name in the data tree pops up a menu.
One of the options is to rename the signal.


