main_page
Main Page
Learn more about HAS-Motion at the company website. Plus check out our blog for overviews of new features and discussions of the biomechanical literature.
HAS-Motion Product Documentation
 Visual3D Visual3D™ is the most advanced biomechanics analysis software for 3D motion capture data available. With Visual3D™ you can accurately analyze 3D movements using your own data, analysis techniques, marker sets, and data capture systems. New updates are regularly released. See the list of release notes for details. Visual3D Philosophy Visual3D Documentation Visual3D Tutorials | Sift Tailored for users handling large biomechanical datasets, Sift is your solution for seamless data analysis with no exporting necessary. Load multiple CMZ libraries simultaneously, simplify data management, and conquer unwieldy databases effortlessly. Dive straight into your datasets with a variety of visualization tools, cutting-edge analysis techniques, and seamless integration of the Visual3D engine into this stand alone application. From incorporating Visual3D pipeline commands to performing Statistical Parametric Mapping, Principal Component Analysis, or outlier detection algorithms, Sift empowers you to complete comprehensive biomechanics analyses within a single application. Sift Documentation Sift Tutorials Sift Release Notes |
|
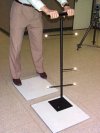
| CalTester CalTester is an easy-to-use tool and software program to provide needed configuration and calibration information of a laboratory's motion and force measurement systems. It also can be used to find the accurate position, orientation, and corners of a force plate used with an optical motion capture system. The CalTester software handles instrumented treadmills and force structures. Note: CalTester+ has been replaced with Visual3D's CalTester tab option. Visual3D can be configured as a stand-alone CalTester application for those who do not have Visual3D licenses.  | Other Software DSX The DSX Suite of Applications processes data from biplanar videoradiography and includes: * XManager * PlanDSX * Surface3D * Orient3D * CalibrateDSX * Locate3D * X4D Inspect3D An earlier application for analysing large biomechanical datasets centered around Principal Component Analysis. Has been replaced by Sift. Visual3D Real-Time Visual3D supports real-time streaming of data with add-on modules for various motion capture systems, providing advanced modeling and virtual marker/landmark capabilities. AMASS Marker Calibration and Tracking for NaturalPoint systems from Dr. Andrew Dainis. Moments of Inertia The Inertia program is based on collaboration with Dr. Fred Yeadon of Loughbrough University. FAQ General License Activation and Deactivation Guidelines General Visual3D run-time or installation issues |
|
main_page.txt · Last modified: 2025/04/15 13:34 by wikisysop
