Inspect3D Query Section: Difference between revisions
Jump to navigation
Jump to search
(→Graphs) |
|||
| Line 40: | Line 40: | ||
* Refresh Plot | * Refresh Plot | ||
** Plots should be updated automatically, but Refresh Plot forces re-drawing of plots | ** Plots should be updated automatically, but Refresh Plot forces re-drawing of plots | ||
Revision as of 17:21, 29 April 2022
| Language: | English • français • italiano • português • español |
|---|
Introduction
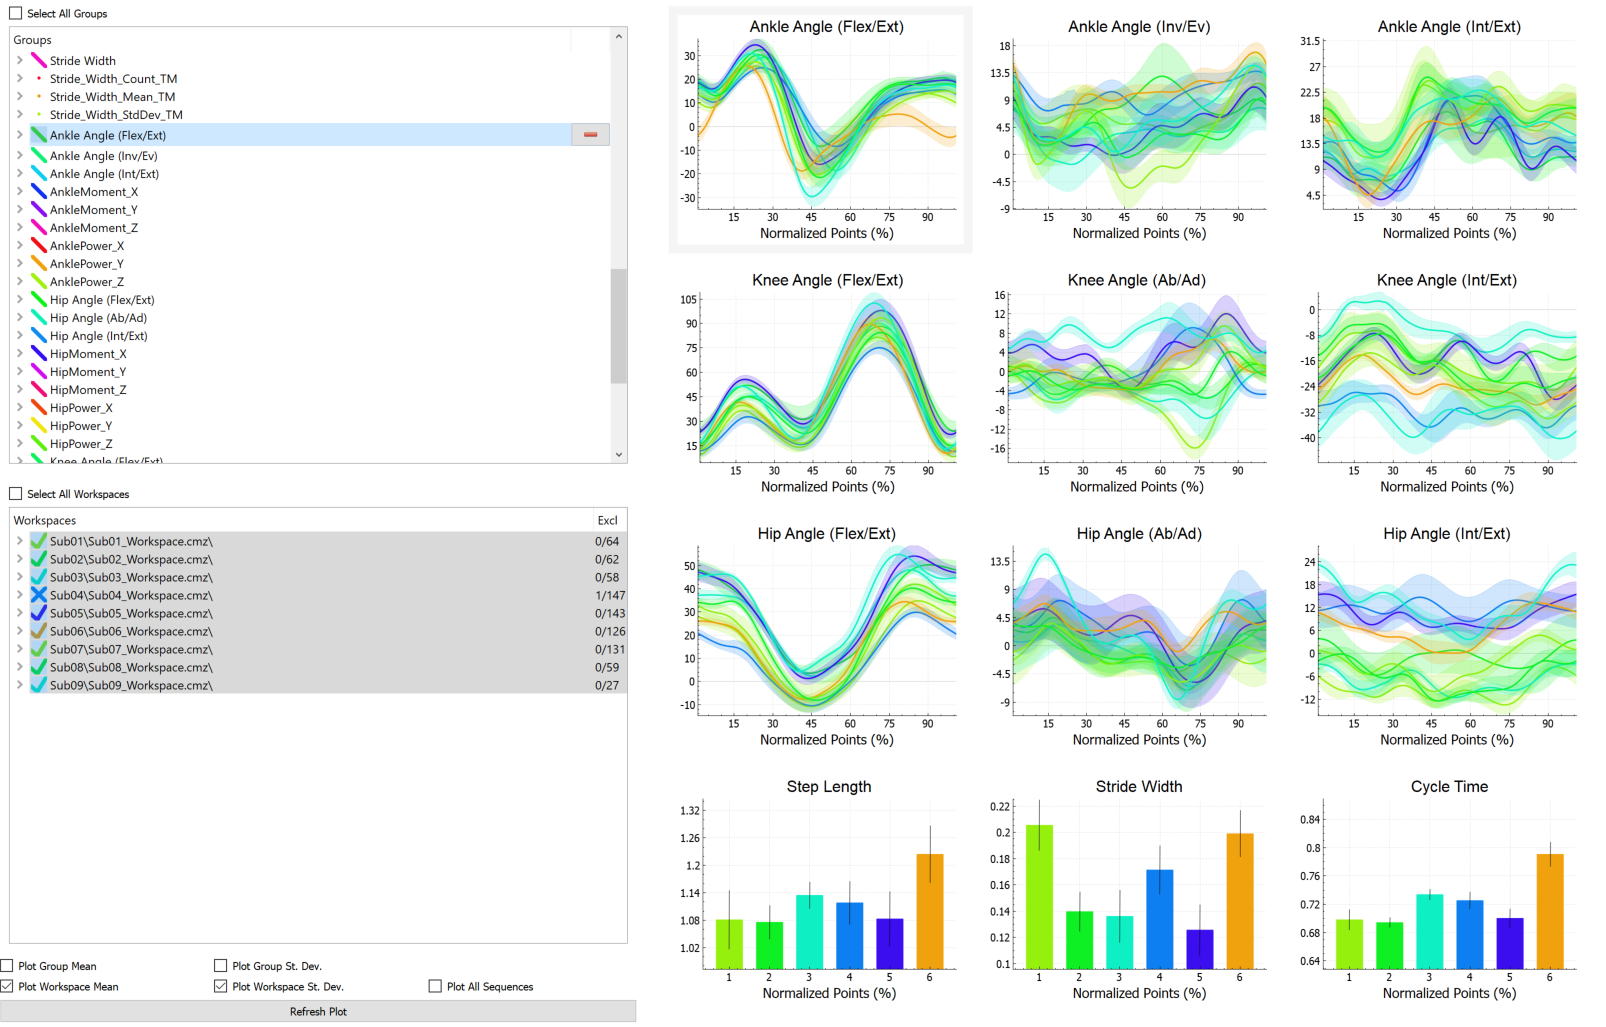
You can define the number of graphs you want to see and can plot any grouped data or workspace by selecting it on the left hand side.
Controls
Graphs
The gray bounding box around the graph let's the user know which graph is being modified.
Groups
You must first define groups.
- You can select all groups to plot all groups on one plot.
- Highlight a group to plot it
Workspaces
- Any workspace that contains data for the selected group will be displayed
- A checkmark indicates all data for that workspace is included
- X indicates that some data is excluded from the average
Plotting Options
- Group
- The Group Mean or Standard Deviation can be plotted
- Workspace
- The Workspace Mean or Standard Deviation can be plotted
- All Sequences
- All cycles or instances can be plotted
- Refresh Plot
- Plots should be updated automatically, but Refresh Plot forces re-drawing of plots
