Using CalTester
The functionality is now available in Visual3D when a CalTester license key is provided. There is also a stand-alone version of Visual3D that ONLY supports the CalTester, and these options now replace the older software. Users of the old software should have access to the new software automatically when they log into our web downloads page.
UPDATE: The standalone CalTester-Plus software application has been discontinued and replaced with a newer CalTester stand-alone application. The new application is simply the CalTester tab in Visual3D all by itself.
As a reminder, always go to the CalTester tab first, before opening any CalTester related data files.
CalTester Background
Accurate and reliable kinematics and kinetics data are essential to the appropriate application of movement analysis data for clinical and research purposes. Proper laboratory calibration includes the accurate determination of the positions of the force platform(s) and cameras in the laboratory coordinate system, as well as correct setting of force platform parameters. Any errors in the parameter settings or calibration measurements will lead to incorrect values of kinetic calculations that rely on the force data.
 ::
::
CalTester is an essential tool for laboratories that:
- Have instrumented Treadmills
- Have instrumented Stairs
- Move cameras and/or Move force platforms regularly
- Have amplifier switches that can be easily bumped, or are regularly changed
- Have settings that are regularly changed
- Have students or unsupervised visitors in the laboratory
- Are required to have regulatory oversight of their laboratory
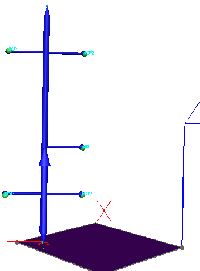
Functionality is based on recording the position and orientation of a standard commercially available precision mechanical testing device MTD-2 CalTester Rod via the motion capture system.
| Implementation of the CalTester functionality was based on the following articles.
|
| Holden JP, Selbie WS, Stanhope SJ(2003)
"A proposed test to support the clinical movement analysis laboratory" |
| Gait and Posture 17, 2003, 205-213 |
| This paper describes a testing methodology and resultant set of four variables that can be used to quickly and easily document the correct installation, configuration, and combined working status of force platform (FP) and three-dimensional (3D) motion capture components of a clinical movement analysis (CMA) laboratory. Using a rigid, rod-shaped testing device, CMA laboratory data are collected simultaneously from the FP and motion capture components (typically, video-based kinematic measurements) as the device is manually loaded while being pivoted broadly about a point on the FP. Using a computational method based on static equilibrium, it is possible to independently measure the rod's orientation and tip position during the moving trial, using FP derived data exclusively, and to compare these estimates to rod orientation and tip position estimates derived exclusively from the motion capture component. The motion laboratory accreditation test (MLAT) variables include: the difference (angle) between the orientation of the long axis of the testing device as independently determined from kinematic measures (motion capture component) and the FP derived data; and the difference (x, y, z) between the center of pressure position (FP derived) and the position of the testing device tip (motion capture derived) that loads the FP. A numerical dynamics model was explored to evaluate the appropriateness of the static equilibrium-based FP data model and to determine guidelines for testing device movement frequency and FP loading. The MLAT technique provides a simple means of detecting the combined presence of errors from many sources, several of which are explored in this paper. The MLAT has been developed to help meet one criteria of the CMA laboratory accreditation process, and to serve as a routine quality assessment tool. |
| [CalTesterReference] |
| Goldberg SR, Kepple TM, Stanhope SJ (2009)
"In Situ Calibration and Motion Capture Transformation Optimization Improve Instrumented Treadmill Measurements" |
| Journal of Applied Biomechanics, 2009, 25, 401-406 |
| We increased the accuracy of an instrumented treadmill’s measurement of center of pressure and force data by calibrating in situ and optimizing the transformation between the motion capture and treadmill force plate coordinate systems. We calibrated the device in situ by applying known vertical and shear loads at known locations across the tread surface and calculating a 6 × 6 calibration matrix for the 6 output forces and moments. To optimize the transformation, we first estimated the transformation based on a locating jig and then measured center-of-pressure error across the treadmill force plate using the CalTester tool. We input these data into an optimization scheme to find the transformation between the motion capture and treadmill force plate coordinate systems that minimized the error in the center-of-pressure measurements derived from force plate and motion capture sources. When the calibration and transformation optimizations were made, the average measured error in the center of pressure was reduced to approximately 1 mm when the treadmill was stationary and to less than 3 mm when moving. Using bilateral gait data, we show the importance of calibrating these devices in situ and performing transformation optimizations. |
| [FPLoc Reference] |
|
| The design of the MTD2 device allows a force to be applied to the surface of the force platform without any applied moment.
|
|
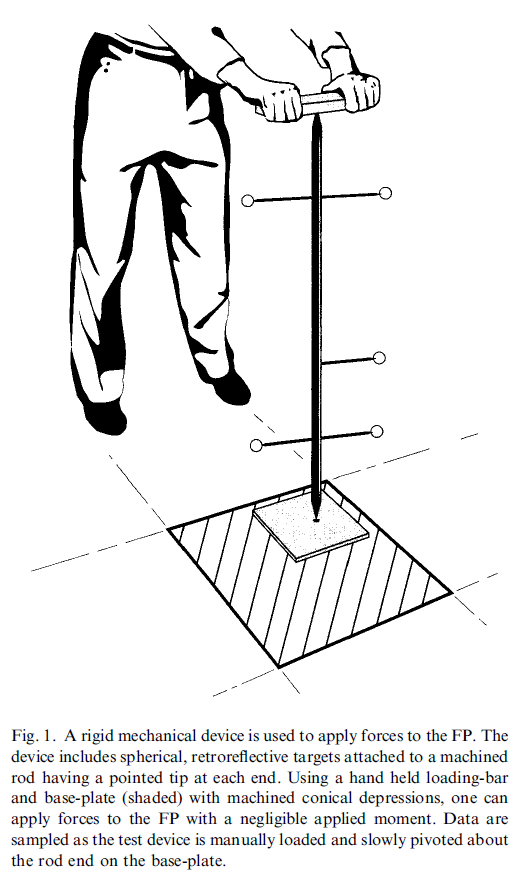
The MTD-2 rod is a rigid, machined rod with a conical (pointed) tip at each end is used together with a handle and a test plate, each with machined conical depressions. Five tracking targets are attached to the testing rod using rigid posts. Data are sampled simultaneously from the force platform (FP) and the cameras, as forces are applied through the rod to the force platform. The Mechanical Testing Device (MTD-2) is manufactured and supported by Motion Lab Systems, Inc. The MTD-2 is a precision-machined calibration-testing tool that can be assembled in less than a minute to create a calibration-testing object suitable for a number of 3D biomechanics laboratory tests. (NOTE: There is an MTD-3 rod that supports adding a load cell on it, and the rods are the same size and work equally well. The MTD-3 may replace the MTD-2.)
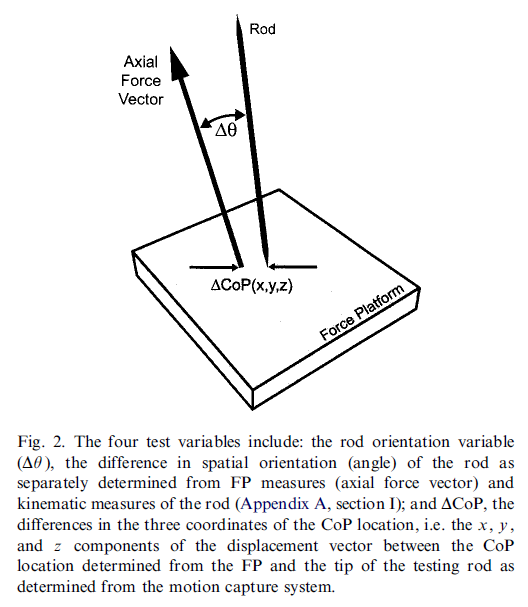
The following graphics are from the CalTester Paper Holden JP, Selbie WS, Stanhope SJ, "A proposed test to support the clinical movement analysis laboratory".
|
Within the CalTester mode there are two classes of functionality:
| Estimate errors in the Center of Pressure and Orientation of the Force Vector.
|
|
Estimate the errors between the force platform recordings and the Motion Capture System. This simple test takes only a few minutes, could be performed prior to any data collection, and provides reassurance that your data collection is sound.
The following calculations and explanations are from the CalTester Paper Holden JP, Selbie WS, Stanhope SJ, "A proposed test to support the clinical movement analysis laboratory".
Section I : Calculating the rod orientation variable
under the assumed condition of static equilibrium
Free-body diagram of testing device: Fp, ground reaction force; Fg, gravitational force (weight); Fa, applied force; r, position vector between tips (p to a) of testing device rod:
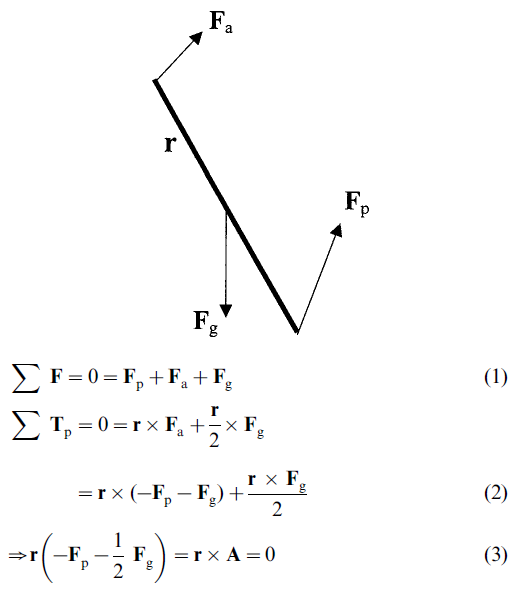
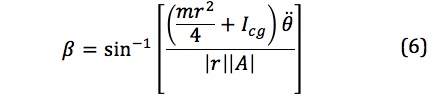
Thus, r and A are parallel and the test device rod orientation (r) is defined entirely by the vector quantity A that is derived from FP measurements (Fp) and the physical characteristics of the testing device (Fg/2, i.e.the weight of the rod and its center of mass location; in this case, half the rod length).

The rod orientation variable (
 ) is determined from the dot product of the unit vector along A and the unit vector aligned with the long axis of the rod (r) as determined using the motion capture components. ) is determined from the dot product of the unit vector along A and the unit vector aligned with the long axis of the rod (r) as determined using the motion capture components.
Section II : Equation for evaluating the static equilibrium assumption
Under 2D dynamic conditions, the following holds:
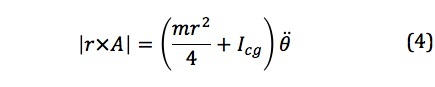
Rewriting the left-hand side of Eq. (4)

Rearranging Eq. (5), the magnitude of the angular displacement (  ) between vectors r and A due exclusively to the inertial terms can be isolated: ) between vectors r and A due exclusively to the inertial terms can be isolated:
where r is the length of the testing device rod, Icg the moment of inertia of the test device rod about the center of mass location, m the mass of the testing device rod and  is the angular acceleration of the testing device rod relative to an inertial reference frame. is the angular acceleration of the testing device rod relative to an inertial reference frame.
CalTesterPlus does not calculate since it operates under the assumption that there is no angular acceleration. For this reason it is important to move the CalTester rod slowly at a constant speed.
|
| Estimate the position and orientation of a force platform, instrumented treadmill, or instrumented stair that minimizes these errors..
|
- Given a set of CalTester Trials
- The first figure is demonstrably poor with the CalTester rod and COP quite far apart.
- It is possible to compute the position and orientation of the force platform that minimizes the CoP Error.
|
Force Platform signals are computed in compliance with [the C3D File Format]
| About Force Platform Parameters.
|
|
Force Platforms, Instrumented Treadmills, Instrumented Stairs are examples of external force measuring devices. Each of these devices generates signals that are recorded by the Motion Capture System.
These signals are used in conjunction with a set of parameters to compute a force signal comprising a Force Vector, a Center of Pressure, and a Free Moment applied to the platform.
The set of parameters, and how they are used in the computations are unique to each manufacturer. The user should refer to the force platform documentation to identify the correct parameters. These parameters are typically stored in the c3d file alongside the signals.
For calculations involving the interaction of an object/person in the motion capture volume and the force platform, it is necessary to establish the location of the force platform in the laboratory, so that the [can be transformed into the motion capture volume].
In most cases the errors identified in the CalTester report are a result of determining the position and orientation of the platform in the motion capture volume, and not in errors from the platform sensors directly.
|
Experimental Data Collection
CalTesterPlus requires consistent data in order to make the correct calculations.
| Assumptions About Data Being Used.
|
|
The program makes the following assumptions about the data that is being used:
- Markers must be labeled in the c3d file produced by the motion capture system.
- Target selection plays a key role in computing the correct output. If the wrong targets are chosen, this program may list the force platform center in an extremely odd location. Due to the nuances of marker labeling that differ between labs, it is difficult to determine which targets on the CalTester correspond to internal vectors of location data within the c3d file. In the case of static, custom target locations, it becomes impossible. That is why the burden of correct identification falls on the user.
- That markers are named consistently in the trials you are using. Even though it is possible for you to name the CalTester Rod markers whatever you want it is essential that they be named consistently; this is because there is only one Marker Labels tab for all trials. For example if the top-left target on the CalTester is labeled #1 for one trial and #5 for another, then it is guaranteed that the program's results will be incorrect. Mislabeling issue can occur during "noisy" data collection trials, and it is the user's responsibility to ensure all targets have a consistent labeling scheme.
- That the axial direction of a lab coordinate system within the c3d files is is a positive x, y, or z direction. It is from one of those directions that the thickness of the caltester test plate is subtracted. This application is usually able to determine which of those 3 directions it is, but a negative axis direction will likely locate the force platform origin a minute amount above its actual location.
|
In order to use the CalTesterPlus program you need a set of properly collected data for each force platform you wish to calibrate.
| Data Collection for Error Report.
|
|
In order to use the CalTesterPlus program you need a set of properly collected data for each force platform you wish to calibrate. To collect a useful motion trial for the report mode follow the following process.
- Each example motion trial that is downloaded with the CalTesterPlus program meets these criteria.
- Set up your capture volume making sure that all force platforms and cameras are in the positions that they will remain in for following data collections.
- Before you begin collecting the trial place the CalTester base plate on the force platform.
- Zero the force platform so that it will not record the force produced by the CalTester base.
- Begin the data capture with the CalTester Rod not in contact with the force platform.
- After a second place the CalTester Rod in one of the CalTester base platform's divots, from this point on the CalTester should be the only thing that comes in contact with the force platform.
- Press down on the rod with a load of at least 200 N.
- Move the rod in both the frontal and sagittal direction:
- Keeping the end of the rod on the force platform stationary move the upper portion of the rod from vertical to 30 degrees from vertical, back to vertical and then 30 degrees in the opposite direction. This movement should take no less than 3 seconds and the force applied should be equal to or greater than 200 N.
- Move the rod in both the frontal and sagittal direction:
- Keeping the end of the rod on the force platform stationary move the upper portion of the rod in an arc (circular motion).
- This movement should be approximately 3 seconds long and the force applied should be equal to or greater than 200 N.
- Focus more on applying a greater force than moving the rod in an large arc. Also make sure that the plate doesn't slide between the force platform and the CalTester rod.
- There should be a minimum of three trials collected per force platform. Ideally there should be 5, one near each corner of the force platform and one near the center of the force platform.
|
| Data Collection for Force Platform Location. (FP Loc Tab)
|
|
To collect a useful static trial for CalTester follow the following process.
- Set up your capture volume making sure that all force platforms and cameras are in the positions that they will remain in for following data collections.
- Make sure the targets on the jig are visible
- Place the CalTester base plate on the force platform before you begin the collecting the trial.
- Zero the force platform so that it will not record the force produced by the CalTester base.
- Begin the trial with the CalTester Rod OFF the force platform.
- After a second place the CalTester Rod in one of the CalTester base platform's divots, from this point on the CalTester should be the only thing that comes in contact with the force platform.
- Press down firmly on the Rod with a load of at least 200 N.
- Keep the Rod aligned vertically and motionless during the trial.
- The trial needs to be at least 1 second long.
- There should be a minimum of three trials collected per force platform. Ideally there should be 8 or more, with at least one near each corner of the force platform and one near the center of the force platform.
|
CalTester Toolbar
Tool Bar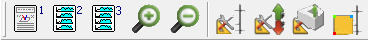
|
|
 View CalTester Report Summary Page 1 - This button helps to control the right side of the screen. When selected, the right side of the screen displays page 1 of the CalTester report, which contains a summary of the full report. View CalTester Report Summary Page 1 - This button helps to control the right side of the screen. When selected, the right side of the screen displays page 1 of the CalTester report, which contains a summary of the full report.
 View CalTester Report Graphs Page 2 - This button helps to control the right side of the screen. When selected, the right side of the screen displays page 2 of the CalTester report, which contains graphs for the Ground Reaction Force Magnitude, the CoP Error (X, Y & Z), and the CalTester Rod Orientation Error. View CalTester Report Graphs Page 2 - This button helps to control the right side of the screen. When selected, the right side of the screen displays page 2 of the CalTester report, which contains graphs for the Ground Reaction Force Magnitude, the CoP Error (X, Y & Z), and the CalTester Rod Orientation Error.
 View CalTester Report Graphs Page 3 - This button helps to control the right side of the screen. When selected, the right side of the screen displays page 3 of the CalTester report, which contains graphs for the CalTester Segment Residual, and Marker Residuals (Top Left, Top Right, Middle Left, Bottom Left, and Bottom Right). View CalTester Report Graphs Page 3 - This button helps to control the right side of the screen. When selected, the right side of the screen displays page 3 of the CalTester report, which contains graphs for the CalTester Segment Residual, and Marker Residuals (Top Left, Top Right, Middle Left, Bottom Left, and Bottom Right).
 Zoom in on the report - This button allows the user to zoom in on the page of the report that is shown on the right side of the screen. Zoom in on the report - This button allows the user to zoom in on the page of the report that is shown on the right side of the screen.
 Zoom out of the report - This button allows the user to zoom out on the page of the report that is shown on the right side of the screen. Zoom out of the report - This button allows the user to zoom out on the page of the report that is shown on the right side of the screen.
 Modify CalTester Rod Dimensions - This button opens the Rod Dimensions dialogue box. Further details on the function of the dialogue box can be found here. Modify CalTester Rod Dimensions - This button opens the Rod Dimensions dialogue box. Further details on the function of the dialogue box can be found here.
 Modify Force Platform Parameters - This button opens the Modify Force Platform Parameters dialogue box. Further details on the function of the dialogue box can be found here. Modify Force Platform Parameters - This button opens the Modify Force Platform Parameters dialogue box. Further details on the function of the dialogue box can be found here.
 Modify Force Structures - This button opens the Modify Force Structure Parameters dialogue box. Further details on the function of the dialogue box can be found here. Modify Force Structures - This button opens the Modify Force Structure Parameters dialogue box. Further details on the function of the dialogue box can be found here.
 Force Platform Locator - This button opens the Force Plate Location dialogue box. Further details on the function of the dialogue box can be found here. Force Platform Locator - This button opens the Force Plate Location dialogue box. Further details on the function of the dialogue box can be found here.
|
Error Report
| Creating the CalTester Error Report
|
|
The report capabilities of the CalTester tab creates an error report based on collection trials.
1. Add C3D files
In order to open a C3d file for use in the CalTester tab you must first navigate to the CalTester tab and leave it active. The C3D files are then opened by clicking on the open button.  This will open a standard file navigation window which you can use to select the files you wish to include in the report. This will open a standard file navigation window which you can use to select the files you wish to include in the report.
2. Check Report
Once the files are loaded the right side of the CalTester tab will show the first page of the CalTester report. You can navigate between the three report pages by using the page buttons in the tool bar. 
3. Print Report
The report that has been generated on the right side of the screen can be saved as a pdf document by using the file drop down menu and selecting Print or by using the Ctrl + P short cut.
4. Understanding the Report
A detailed explanation of how to understand the report that CalTester produces can be found here.
Note:
If there appears to be errors or discrepancies in the report or the 3D-view check that the markers have been identified correctly and that the rod dimensions are correct using the Modify CalTester Rod Dimensions button.
|
| Understanding Report Page 1
|
|
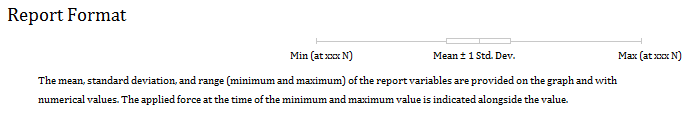
The Laboratory Calibration Test Report includes the mean, standard deviation, and range (minimum and maximum) of the four report variables. These are provided on graphs and with numerical values.
(1) The background on the file: the top of the report contains the summary of the c3d file being used. This includes the number of frames used, the minimum force settings (for CalTester and Visual3D), and the dates the c3d file was collected and when the report was created.
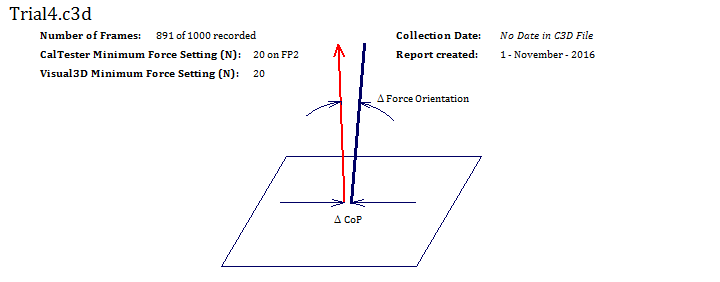
(2) The report format: the second section of the report provides an overview of how the information on the rest of the page will be organized.
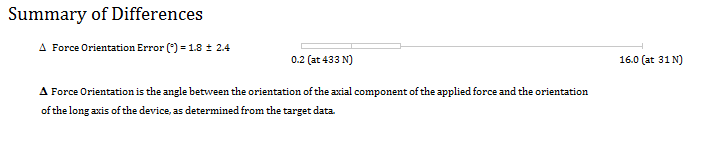
(3) The Difference in Force Orientation Error: this is the angle (in degrees) between the applied force reaction vector (i.e., the ground reaction force minus the weight of the calibration-testing rod) and the orientation of the long axis of the rod, as determined from the target data.
Note: The force orientation variable is calculated from the dot product of this predicted unit vector and the vector along the axis of the rod as determined with the motion capture system.
(4) The differences in CoP (for x, y, and z): these are the components of the displacement vector between the CoP location measured by the force platform and the endpoint of the calibration-testing rod (adjusted for the specified vertical height above the force platform).
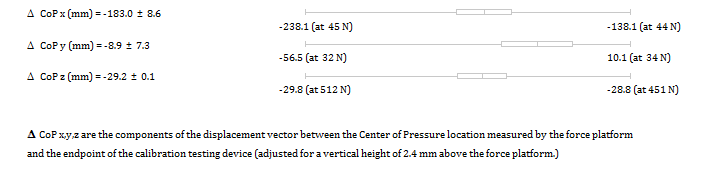
Differences can be due to many different factors, including errors in the force platform configuration (analog scale factors, force platform origin specification), the force platform interface (channel connections and assignments), or the force platform alignment (corner locations, which are used to transform force platform data into the laboratory coordinate system). Differences due to the kinematic system are related to uncorrected camera non-linearities, poor 3D calibration, and target image distortions.
If CalTester detects large differences, additional data collection trials may be helpful in identifying the source(s) of the differences. The additional tests may include separate data collection trials using movement arcs in only one of the vertical planes, or a circular movement arc. Tests in each of the four quadrants of the force platform may also be helpful. The significance of the measured differences is a professional judgment that must be made by each laboratory in light of its specific applications. (Keep in mind that the measurement resolution of laboratory systems will limit how small one can reasonably expect the differences to be.) Also, the CalTester technique is sensitive to a great many parameters, but the process of identifying the parameter(s) that most contributes to differences will likely require a thorough understanding of the measurement systems by the user.
If CalTester detects an inconsistent value for the location of the origin of the force platform, it assumes that the data file was generated from a VICON system and indicates that beside the filename on the report.
|
| Understanding Report Page 2
|
|
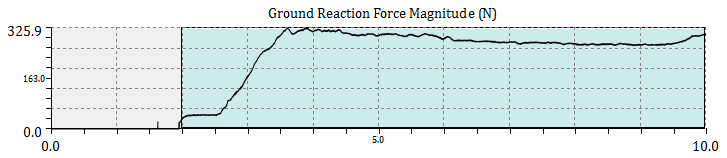
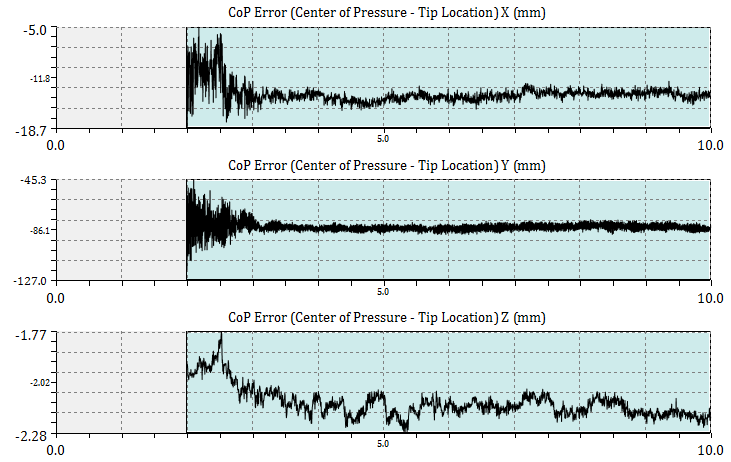
The magnitude of the force vector and the error signals are displayed in the Graphs tab of the Report.
The CalTester Center of Pressure error is measured and graphed for the X, Y and Z directions for each of the frames of data.
The orientation of the rod with regards to the vertical is graphed as well as the error of the orientation.
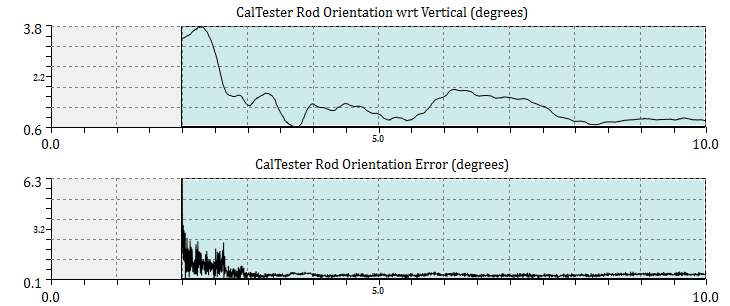
From this view the user can select the range of data to be processed. This will allow the user to eliminate anomalous data from the calibration calculations. To select the range, left click and drag the mouse on the Ground Reaction Force Magnitude graph. A green highlighted section will appear on the graph and all of the graphs will be limited to this range. To return to the original range, left click on the Ground Reaction Force Magnitude graph and the full range will return to all of the graphs.
|
| Understanding Report Page 3
|
|
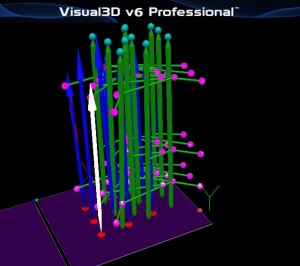
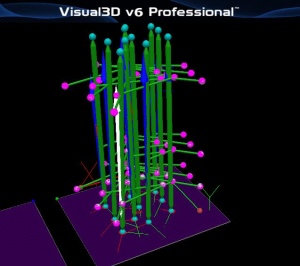
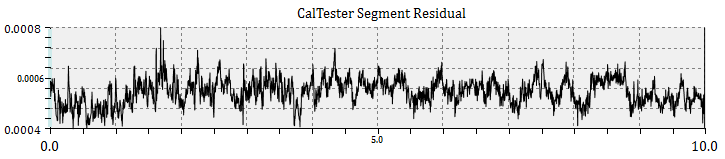
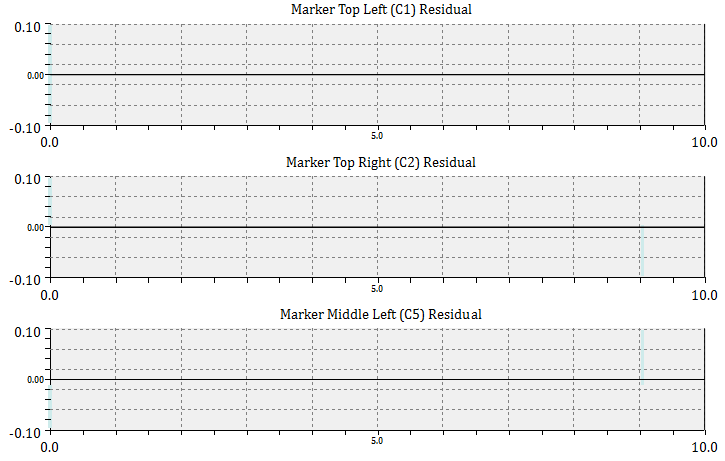
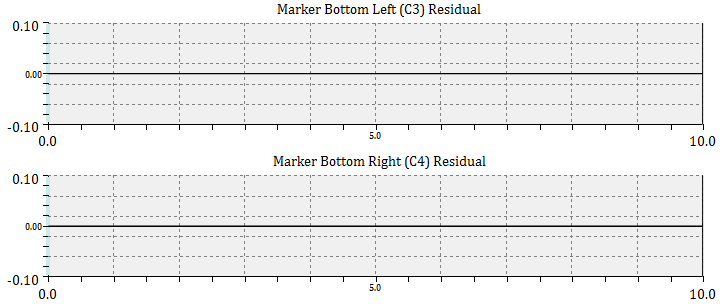
The third page of the report has six graphs. The first graph is the CalTester Segment Residual Graph. This graph shows the residual of the whole CalTester Segment during the trials that were used.
The final five graphs show the residuals for the individual markers. For the sample shown below the markers that are used are: C1, C2, C5, C3, and C4.
|

|
|
The controller allows the user to run through the 3D animation. On the left hand side of the controller there are five blue buttons which allow the user to play/pause, jump to the beginning/end, and jump forward/back one frame at a time. The text box to the right of the play buttons tells the user which frame the 3D view is on, with the corresponding time next to it. The slider beneath the frame box allows the user to increase or decrease the speed of the playback from 0.5 to 5 times its normal rate. The blue slider indicates where in the c3d file the 3D view is; it can also be used to control scrolling through the file. The radio button at the far right allow the user to switch between playing the 3D view at its capture rate and every frame.
|
Estimating the Force Platform Location
| Estimating the Force Platform Location
|
|
It will produce a written report detailing the force platform's exact location in your lab. This report can be saved as a text file and the values can be inputted into the data collection software that you use.
- Load the files into Visual3D while the CalTester tab is active.
- Click on the Force Platform Locator button in order to open the Force Platform Locator dialogue box.
- Make sure that the FPLoc tab is selected.
- In the Select Force Platform section, select the Force Plate you whish to locate using the drop down box.
- In the Define Force Platform Dimension section, check that the FP Length and FP Width are correct. If they are, make sure that the Use Current Dimension radio box is selected. If they are not, select Use New Dimension radio box and change the FP Length and FP Width to the correct values.
- In the file list at the bottom of the box, select the C3D files that have both the force plate and the jig in the same location. At least 3 files must be used, but it is recommended that at least 8 be used.
- Click on the Compute Optimal Configuration button.
- Wait for Visual3D to calculate the configuration. This may take a few seconds.
- The CalTester Results window will open and present the following: the output for the force platform, the corrected location (in mm), the force platform center, the rotation matrix (into lab space), the cardan angles to rotate from lab to force platform, the cardan angles to rotate from force platform to lab space, the nexus orientation parameters, and the Visual3D command.
- If you wish to save the output you can click on the Export to text button at the bottom left of the results dialogue box.
A sample of the output that should be created is provided below:
- Output for force platform 1 :
- ======== Corrected Locations (in mm): ========
- Corner 1: -624.8758, 685.1889, 1.5064
- Corner 2: -17.5759, 687.8662, 1.6895
- Corner 3: -14.8988, 80.5641, 2.1519
- Corner 4: -622.1987, 77.8868, 1.9688
- Force platform Center:
- -319.8873, 382.8765, 1.8292
- ===============================================
- Rotation Matrix (into lab space):
- -0.999990 -0.004408 0.000305
- -0.004408 0.999990 -0.000760
- -0.000302 -0.000761 -1.000000
- Cardan angles to rotate from lab to force platform
- Angle 1 (x): 179.956451
- Angle 2 (y): 0.017473
- Angle 3 (z): 179.747421
- Cardan angles to rotate from force platform to lab space
- Angle 1 (x): 179.956375
- Angle 2 (y): -0.017281
- Angle 3 (z): 179.747406
- Nexus orientation parameters:
- -0.043584
- -0.017377
- 0.252580
- Visual3D Command
- Modify_One_Force_Platform
- /FP_SELECTED= 1
- /FP_CORNER1= -624.8758 + 685.1889 + 1.5064
- /FP_CORNER2= -17.5759 + 687.8662 + 1.6895
- /FP_CORNER3= -14.8988 + 80.5641 + 2.1519
- /FP_CORNER4= -622.1987 + 77.8868 + 1.9688
|
Estimating the Force Platform Location Using a Jig
When using movable force platforms (ex. incline treadmill, etc.) you will want to use a jig to specify the force platform location. The jig is a cluster of targets which are fixed to the force platforms. First the jig must be defined by locating the force platform relative to the jig. Then the jig can be used to identify the location of the force platform.
| (1) Defining a Jig for Specifying the Force Platform Location
|
|
By creating a jig the user can identify the location of a force plate without having to repeating the entire CalTesterPlus platform protocol each time. In order to use this function you need to have a set of permanent markers (i.e. a template or a jig) which have a consistent position relative to the force platform.
- Load the files into Visual3D while the CalTester tab is active.
- Click on the Force Platform Locator button in order to open the Force Platform Locator dialogue box.
- Make sure that the Define Jig tab is selected.
- In the Select Jig section, click the Add New Jig button.
- In the Define Jig Targets section, use the drop down menu at the left of the section to select the targets that are included in the jig and click Add Targets. Do this until all of the targets that are in the jig are listed in the Target list to the right of the section.
- In the Force Platform section, select from the FP drop down menu that you wish to locate with the Jig.
- In the Define Force Platform Dimension section, check that the FP Length and FP Width are correct. If they are, make sure that the Use Current Dimension radio box is selected. If they are not, select Use New Dimension radio box and change the FP Length and FP Width to the correct values.
- In the file list at the bottom of the box, select the C3D files that have both the force plate and the jig. A minimum of 3 C3D files must be used to create the Jig File.
- Click on the Calculate Results button in order to produce the CalTester Results window. This window can be exported by using the Export to text button in the bottom left of the screen.
The original output was provided as a Jig Template (example below):
- ==== Fixed marker locations in force platform space (MKS units) ====
- /JIG_NAME = Jig_1
- /FP_TESTED = 1
- /USE_FP_DIMENSIONS = FALSE
As of Visual3Dv6.00.29 the output is provided as a Visual3D pipeline command (example below):
- Platform_Corners_From_Jig
- /JIG_NAME=Jig_1
- /FP_SELECTED=2
- ...
|
When using the jig to identify the location of the force platform, there are two options. If you are using the jig template (Visual3Dv6.00.28 & older), you must follow the instructions for 2a. If you are using the Visual3D pipeline command (Visual3Dv6.00.29 & newer), you can follow the instructions for 2b.
| (2a) Specifying the Force Platform Location using a Jig Template
|
|
The CalTester tab can define the location of the Force Plates in lab coordinate system based on the location of the Jig (how to define the location of the Jig is described above).
- Load the files into Visual3D while the CalTester tab is active.
- Click on the Force Platform Locator button in order to open the Force Platform Locator dialogue box.
- Make sure that the FP Loc (Jig) tab is selected.
- In the Select Jig section, if the Jig you wish to use is already listed in the text box, select it, otherwise click on the Load Jig File button and select the Jig File that you created using the Defining a Jig tutorial above.
- At the bottom of the dialogue box, select the C3D files that should be updated using the selected jig.
- Click on the Calculate Results button.
|
| (2b) Specifying the Force Platform Location using Platform_Corners_From_Jig Command
|
|
If you output the jig results as a pipeline command (available in Visual3Dv6.00.29 and newer), you can use the Platform_Corners_From_Jig Command to update the force platform corners.
- Load the files into Visual3D (not in the CalTester tab)
- Run the Jig command (Platform_Corners_From_Jig) on the relevant files
The force platform corners will be updated based on the location of the jig.
|
Tutorials
Videos to describe using CalTester can be found on YouTube:
If you prefer a course format, this information can also be viewed in the links below (same videos, different format with additional content):
Acknowledgement
C-Motion, Inc. acknowledges that the development of CalTester software was funded in part by an STTR grant (R43 HD37286) from the National Institute of Child Health and Human Development (NICHD). C-Motion also gratefully acknowledges assistance provided by the Physical Disabilities Branch in the Warren Grant Magnuson Clinical Center at the National Institutes of Health.
 ::
::


