Sift - Explore Page: Plot Controls: Difference between revisions
Jump to navigation
Jump to search
(Created page with "The Explore Page's plot controls sets the type and style of data displayed in the plot viewer, there are four different types of plots: <ul> <li><strong>Signal Time</strong>...") |
No edit summary |
||
| Line 14: | Line 14: | ||
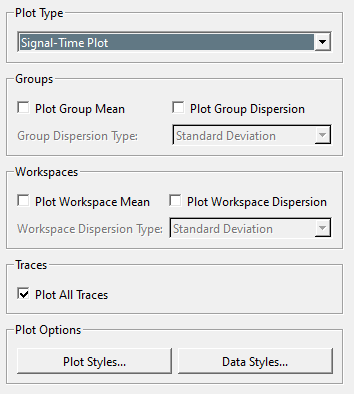
==Signal Time== | ==Signal Time== | ||
[[file:sift_signal_time_plot_controls]] | [[file:sift_signal_time_plot_controls.png]] | ||
<br> | <br> | ||
Revision as of 19:11, 18 March 2024
The Explore Page's plot controls sets the type and style of data displayed in the plot viewer, there are four different types of plots:
- Signal Time: Plots a continuous value over the course of time.
- Metric: Plots a discrete calculated value.
- Signal Signal: Compares a pair of continuous values.
- Metric Metric: Compares a pair of discrete values.
