Sift - Plot Legend Dialog: Difference between revisions
Jump to navigation
Jump to search
No edit summary |
No edit summary |
||
| Line 10: | Line 10: | ||
[[image:LegendContext.png|400px]] [[image:LegendMenu.png]] [[image:LegendChoices.png]] | [[image:LegendContext.png|400px]] [[image:LegendMenu.png]] [[image:LegendChoices.png]] | ||
[[Category:Sift]] | |||
Latest revision as of 17:21, 21 March 2024
| Language: | English • français • italiano • português • español |
|---|
Plot legends can be added to any plot on the explore page and any of the four plot types: Signal-Time, Metric, Signal-Signal, and Metric-Metric.
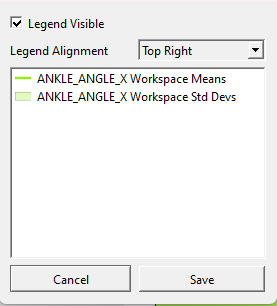
By right clicking on a plot, users can select "Legend" from the context menu. The Legend menu will enable options once the user selects "Legend Visible". The legend automatically populates the signal names based on the group and if it is the raw data or the dispersion. By making the legend visible, users can select the alignment of the legend (in any corner of the plot).


