Real-time Pipeline/Biofeedback
| Language: | English • français • italiano • português • español |
|---|
RT Pipeline
For each packet of streaming data received by Visual3D.
- The pose of the model is estimated.
- The RT pipeline is executed.
The RT Pipeline contains a subset of the commands in the Post Processing pipeline because only some of the commands make sense in the real time stream.
RT_ModelBased
RT_Events
Only two of the Events commands exist.
Note that automatic_gait_events relies on the Forces being assigned to a segment.
RT_SignalMath
RT_Graphs
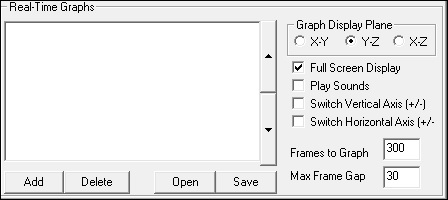
RT_Graph_Dialog
There are many options for the realtime graphs.
Recent additions to the graphs include a new Speedometer and Circular Angle Graph.
The Adjust Graph Position option is a new feature that allows the user to manually move the graphs around.
- Typical values should be between -2 and 2. Exceeding those values may send the graph outside of the normal viewing area.
- The position adjustment stacks on top of the row / column location, so adjust the row / column first and then make any fine adjustments using the new feature.


