Visual3DServer Tutorials Biofeedback V3DRealtime
| Language: | English • français • italiano • português • español |
|---|
VISUAL3D SERVER HAS BEEN REPLACED BY THE VISUAL3D PLUGINS
Purpose
This tutorial shows you how to generate real time feedback from the Visual3D RealTime Tab when streaming from Visual3DServer. The pictures and example in this tutorial are specific to streaming a C3D file through Visual3DServer. However, the same principles can be applied to any plugin which supplies marker or force plate data. To run biofeedback through Visual3D with a C3D file without using Visual3D Server use this tutorial.
Steps
1. Making sure Visual3DServer is running
The Server may either be streaming a c3d file as described in the C3D set up tutorial or it may be receiving data from one of the following plugins:
- AMTI
- AMTI Type 6
- Bertec
- Mac Cortex
- NP Motive
- NDI First Principles
- NP OptiTrack
- Qualisys
- Vicon
2. Making sure you have the files you need
Before beginning this tutorial if you are following from the C3D tutorial make sure that you have:
1. Downloaded the file model.zip
2. Saved the file to where you would normally save motion capture files and unzip it.
3. Make sure that you have both Walking_Hybrid_2.c3d and model.cmo
These sample Qualysis files were downloaded from C3D.org.
If you are streaming your own pre-recorded data or a live subject make sure that you have a model file (saved as a .cmo) built and ready to apply.
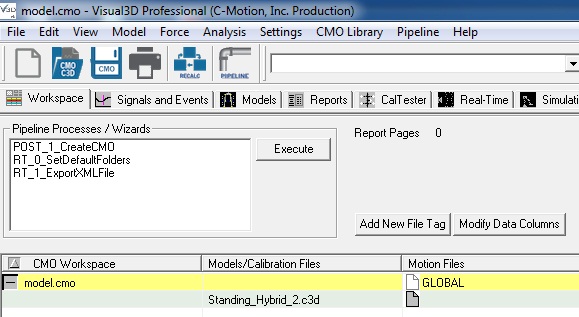
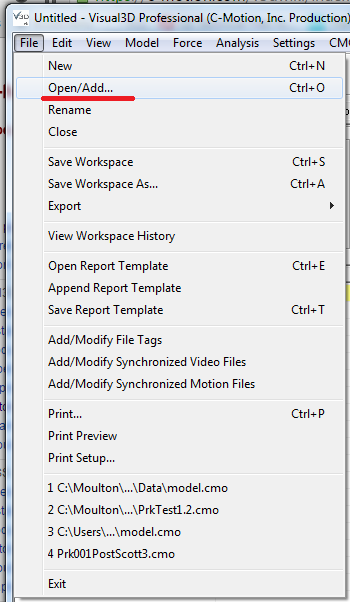
3. Open Visual3D
|
3. Switch to the Models tab to verify bones in picture |
 |
4. Connect to RealTime stream
|
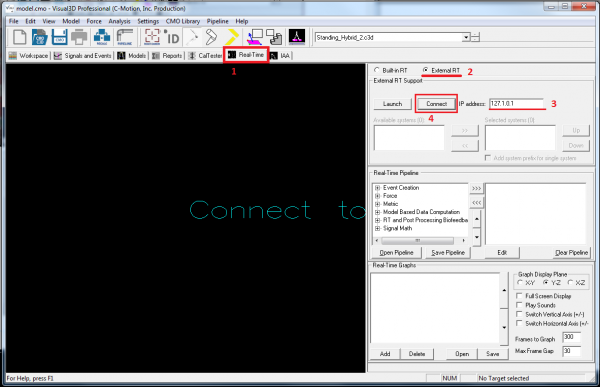
1. Open the Real-Time tab in Visual3D. 2. Select External RT radio button. “Connect to Visual3DServer” will be shown in animation window. 3. Make sure that the IP of the computer running Visual3DServer is entered into the IP Dialogue Box. If Server is being run on the same computer as Visual3D then localhost or 127.0.0.1 can be used as a short cut. If you need help finding your computer's IP address see the Trouble Shooting section. 4. Click the connect button. 5. C3D should appear in the Available Systems box. Select C3D and click on the top set of arrows in order to transfer C3D to the Selected Systems box.
6. There should now be marker and force plate data in the animation window. |
 |
5. Creating a Pipeline and Graph
This tutorial will cover creating a simple graph for the Left Knee Angle. If you would like a detailed explanation of all the available pipeline commands available click here [link]. If you would like a detailed explanation of the options for customizing a graph click [here].
|
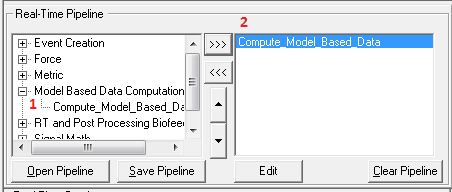
1. Expand the Model Based Data Computations catagory in the list of pipeline options. 2. Select Compute_Model_Based_Data and use the top set of arrows to move the command to the pipeline builder window. |
|
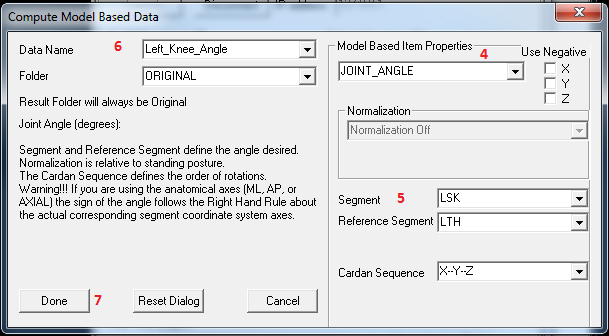
3. Either double click on Compute_Model_Based_Data in the pipeline window or select it and click on Edit, which is located at the bottom left of the pipeline window. This will open the Compute_Model_Based_Data dialogue box. 4. From the Model Based Item Properties drop down box select JOINT_ANGLE. 5. Set the Segment to LSK and the Reference Segment to LTH. This will compute the left knee joint angle by calculating the angle between the Left Shank (LSK) and the Left Thigh (LTH). 6. Select the Data Name dialogue box and type in Left_Knee_Angle. 7. Click Done. |
|
8. Click on the Add button at the bottom left corner of the Real-Time Graphs section. 9. Make sure that the 2D Graph tab is selected at the top of the dialogue box. 10. In the Data to drop down menu select LINK_MODEL_BASED::Left_Knee_Angle. 11. Click on OK. |
6. Inspect Output
Below is a sample of what you should see.
Note: you may need to reorient the 3D View to see the graph well.
If you wish to see your options for customizing the graph click here [link], if you would like to graph other variables click here [link].
