2D Interactive Graphs
The quickview function available by left-clicking on any signal in the Data Tree can provide you with simple graphs. To look more closely, you can add up to five graphs in the graphs display area at the right side of the Signal and Event Processing page. The functions to create graphs are available on the pop-up context menu which appears when you right-click on the signal of interest in the data tree. When a signal is selected for graphing, its data-tree icon temporarily changes to a little graph, as shown in the following illustration.

Visual3D’s graphing capabilities are quite extensive. Three aspects are worthy of note here. First, the x, y and z coordinate values of point-valued signals are normally plotted separately (as shown in the illustration above), but you can choose to overlay the graphs of two or more such signals. Second, graphs in the graphs display area are interactive&emdash;you can use the mouse to zoom in on specific areas. Third, you can define events (see below) by clicking with the mouse at appropriate points on any graph.
QuickView
- The quick view graphs are only available when a single file is active in the Workspace. This is because the QuickView graphs contain the processing history of the selected signal, and it would be challenging to display the processing history for multiple files simultaneously.
To Open and Use Data View
- In the data tree on the left:
- Click the + sign next to TARGET folder to open the inner folders.
- Click the + sign next to ORIGINAL subfolder. This reveals the contents of the original c3d data file. The red dots are the original signals as labeled by the capture system.
- Click on the marker labeled LFT2. with the Left Mouse Button The Data View dialog box will open to the Data Values tab. Here you can see raw data or to export to an ASCII file
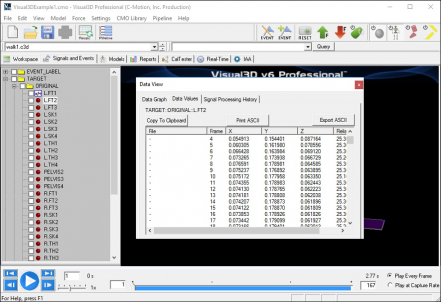
- On the Data Values tab scroll down to the 24th frame. This is where the data capture system began to collect data for this segment. No data was recorded for this segment in the previous 23 frames. This is not abnormal but it is good to be aware that some markers will not have data for every frame. The reasons for this vary but in this particular case the left foot was not in view of the cameras until the 24 frame. If you see blank frame in the middle of a data set it may be an indication of an erroneous result.
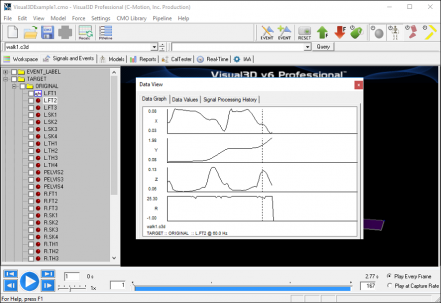
- Open the Data Graph tab to view analog graphs. A Quickview can help you to locate obviously incorrect or noisy data.
- Open the Signal Processing History tab. Although this tab is currently empty, you can view the processing history of signals here. Visual3D has a command pipeline which allows the user to prepare scripts for processing data. Typically these commands create new data that is derived or interpolated from their original data. Determining the distance between 2 points would be an example of such deriving data. The Signal Processing History tab will tell you what events if any took place on the data.
- Close the graph by clicking on the X in the top right-hand corner of the Data View dialog box.

.png)
NOTE: The Data View can only be used for one Active file at a time. If you select ALL_FILES or a TAG, the Left Mouse Button click will not do anything.
An exception to this rule is that Metric signals will be displayed for more than one active file.
Displaying a Signal Graph
There is another way to view signal graphs which is different from signal data graphs in the Data View window. These are "interactive" and offer different viewing options of the data which we will explore later. When activated, signal graphs appear on the right-side of the screen and can be used to visualize or add event labels.
To activate an interactive signal graph
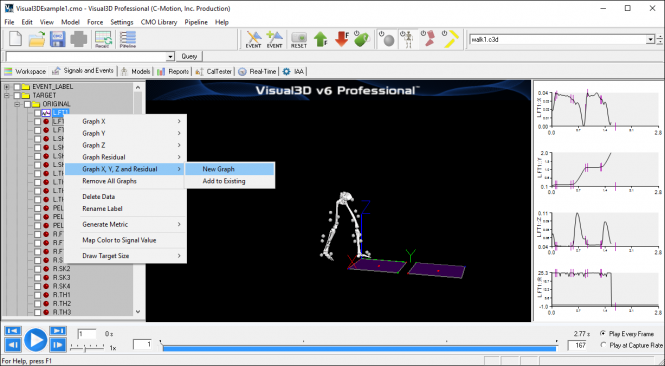
- In the data tree on the left, if it's not open already open the TARGET folder.
- In the ORIGINAL subfolder, right-click the target LFT2.
- Open Graph X, Y and Z, and Residual and select New Graph. A set of graphs will open on the right side of the screen.
- Place the mouse on any point of one of the graph lines and wait.
Note: The technique used here is called a mouse over. When you hold the mouse still long enough a yellow tool tip window will appear which displays information about that point on the graph. This corresponds to one frame of data in the motion capture.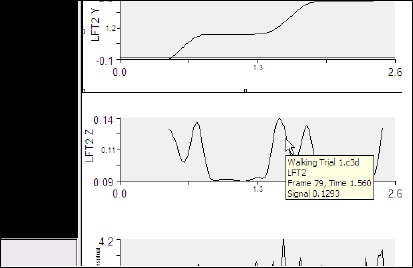


Control and Shift Keys
- If the Control Key is pressed when the Left Mouse Button selects a signal, the 2D graphs are deleted and replaced with all components of the selected signal
- If the Shift Key is pressed when the Left Mouse Button selects a signal, all components of the selected signal are added to the existing graphs
- Note that the functionality of Shift and Control keys is related to the Interactive Graphs, not the Quick Graphs, so this will function regardless of the number of active files.
Formatting Interactive Graphs

- Click on a graph to activate the interactive features. Small boxes will be displayed around the graph when the graph has been selected.

- Holding the LMB down and moving the cursor up and down scales the graph and moving the cursor left and right pans the graph.
- As the range of data is changed the scaling of the vertical axis changes to reflect the data displayed automatically.
- Clicking the RMB will bring up a context menu of options for manipulating the graphs.

- Note: Signals are drawn for individual files or for all files. If the signal to be drawn exists in only one file of the set of opened files, and that file is not selected, the graph area for that file is left blank. Because of the limit of five graphs simultaneously, it is possible that a file is selected for which no signals are drawn and the entire interactive view is left blank. Attempting to add a new graph will result in an error message saying that there is no more room for an additional grant. The only solution is access the graph menu using the Right Mouse Button and Remove one or more graphs from the list.
Formatting and Animating a Signal Graph
- From the View menu, click on View Graph Animation Frame Line. This will create a line on the graph to correspond to a point in an animation. Then click PLAY in the VCR control panel to activate the animation. The vertical line on the signal graph will move along with the 3D figure.
Note: This may already be up by default. - To format the signal graph, right-click anywhere on the graph to open an options menu. Select Format Graph.
Note: You can also select multiple graphs first using the CTRL key on your keyboard. Any changes you make will apply to each graph you select.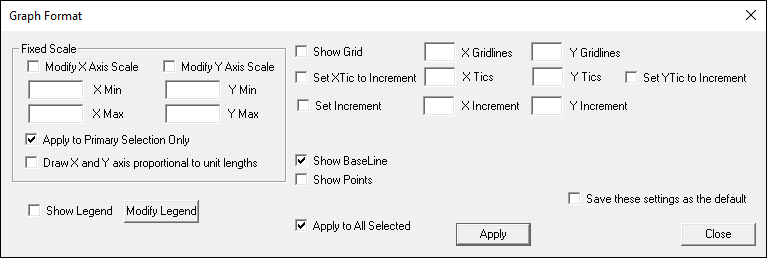
- Enter your desired changes and click Apply. Not all of the options apply to the Signal and Events Processing tab. Below are some of the options that do apply. Other options will be covered later in the Reporting tab.

- Show Grids: Adds the number of X and or Y grid lines you specify.
- Tics: Add or subtract tic marks to the axes.
- Proportional Units: Makes width units equal to length units.
- Show Points: Shows a small box for each frame on the graph.
- Show BaseLine: Shows a line at zero.
- Apply to All Selected: Applies the changes to multiple graphs if you have more than one selected.
- Apply to Primary Selection Only: Applies the changes to only the first graph you selected if you have multiple graphs selected.
2D Graphs Context Menu
- Clicking the RMB will bring up a context menu of options for manipulating the graphs:
X-Axis Control
- Allows scaling and movement along the X-Axis when checked
Y-Axis Control
- Allows scaling and movement along the Y-Axis when checked
Auto-Range
- Automatically scales the Y axis to the current range of frames when checked.
Recalculate
Format Graph
- Displays a dialog box containing options for modifying the format of the graphs
Select All
- Selects all of the displayed graphs Reset Selected Resets all selected graphs back to their original scales and ranges
Reset All
- Resets all graphs back to their original scales and ranges
Reset Selected
- Reset the selected graph(s)
Export
- Exports one or all graphs to a variety of formats

Copy

Remove All Graphs
- Removes all graphs Remove a Graph Displays a dialog box to allow removal of individual graphs
Remove A Graph
- A popup dialog allows the user to remove a graph.

Save Graph Layout
- Saves the current graph layout to to a layout template
Load Graph Layout Replaces
- the current graph layout with a saved graph layout
The Graph Layout Template
- Note: as a shortcut it is possible to save the interactive graph layout to a file. For example, remove all graphs then click with the RMB in the graph view and graph layout fp1fp2rft1.grt. This will load three graphs; Force platform1, Force platform 2, and one foot trajectory target.