AMASS2 identification basics
Introduction
The Identify program reads a .seg file and a set of Identify parameters, and presents a graphics interface that enables the user to associate marker labels with segments. Once all useful segments have been identified the data can be written to a .c3d file for analysis with any program that accepts .c3d files as input.
The documentation for identifying is divided into three parts. This section describes the Identify parameters and details of the Identification window. The second part (Manual_identification) describes a simple method for associating segments with marker labels. This method is straight forward to learn, and is sufficient when there are not many markers and the segments have good continuity.
More complex applications involving many markers or fragmented segment data require more sophisticated tools for efficient identification of segments. The third part Identification using links describes an advanced method that utilizes links between markers. A link is a user defined association between two markers stating that their separation remains more or less constant over all frames throughout the trial. Link information aids the identification of multiple segments belonging to the same markers, and can be saved to a link (.lik) file for use in automatically identifying segments in other, similar trials.
Identify parameters
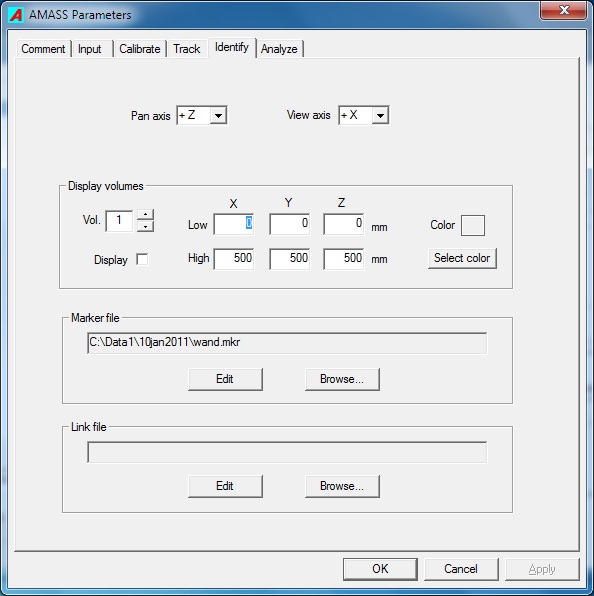
- Pan axis
- When the left mouse button is held down and the mouse is dragged left or right in the Identify 3D view display, the image will rotate about the vertical screen axis. The Pan axis defines which of the Global Coordinate System (GCS) axes aligns with the vertical screen axis. The user may select the negative or positive direction of any of the three GCS axes through this parameter.
- View axis
- This setting determines along which GCS axis the initial view of the markers is presented. During identification the view will typically be changed by the user as the image is manipulated by panning, tilting, and zooming.
- Display volumes
- The user may create up to ten “virtual” boxes in the Identify 3D view to mark regions of interest and aid in identification of segments. The boxes are defined by Low and High corner points in the GCS, where every Low coordinate is less than any corresponding High coordinate. Any box may be reduced to a plane by the entry of the same value in a common Low and High coordinate, i.e. if the floor is at the z-coordinate of -20, then entering -20 in the z-component of Low and High corners will cause a plane to be drawn at z = -20 user units. The size of the plane is specified by the other two coordinates.
- Volume number
- This box allows the user to select the volume number to be edited.
- Display
- The check box tells whether the particular volume box is to be displayed when the Identify program starts. Within Identify the facility exits to turn on and off the display of individual volumes.
- Low coordinates
- These three values hold the X, Y, and Z coordinates of the Low corner of the box.
- High coordinates
- These three values hold the X, Y, and Z coordinates of the High corner of the box. Each High coordinate value must be equal or larger than the corresponding Low corner value. Only one (x, y, or z) coordinate of Low and High corners may be equal, in which case a plane will be drawn.
- Color
- The user can choose a color for the wire frame of each box when it is displayed. The Select color button presents a color picker window from which the user can select a standard color or create a custom color.
- Marker file
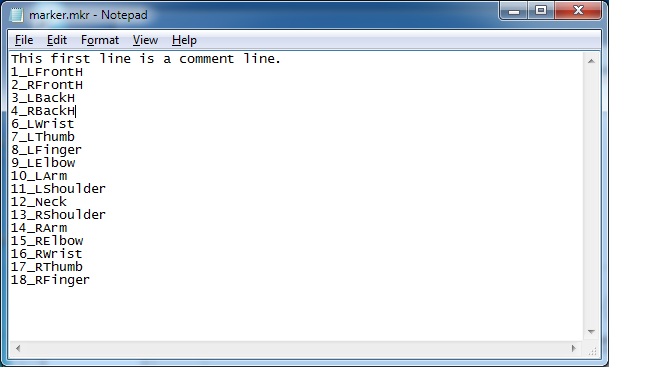
- The marker (.mkr) file is a file containing the marker labels that the user applies to the segments during the identification process. Clicking the Edit button launches Notepad and allows the user to edit the file. Clicking on the Browse… button allows the user to load an existing .mkr file or create a new one.
- To create a new Marker label file, click Browse…, and in the browse window type in a file name, select a destination folder, and then click Open. A window will pop up asking if you wish to create a new file. If you answer Yes a NotePad window will open allowing you to enter marker labels. After the comment line type in one marker label per line, 32 characters maximum, and then save the file. A marker description (32 characters maximum) may also be added to each marker label after a slash (/).
- Note: If the .seg file you are processing has saved identifications, the marker file must have at least as many labels as the highest numbered identified marker.
- Link file
- This entry accepts the name of a link (.lik) file which contains a list of marker label pairs that are to be joined in the 3D view and are used to assist labeling of segments. Clicking the Edit… button launches Notepad and allows the user to edit the file. Clicking on the Browse… button allows the user to load an existing .lik file or create a new one. Typically link data will be created interactively as described later in Defining links.
The Identify screen
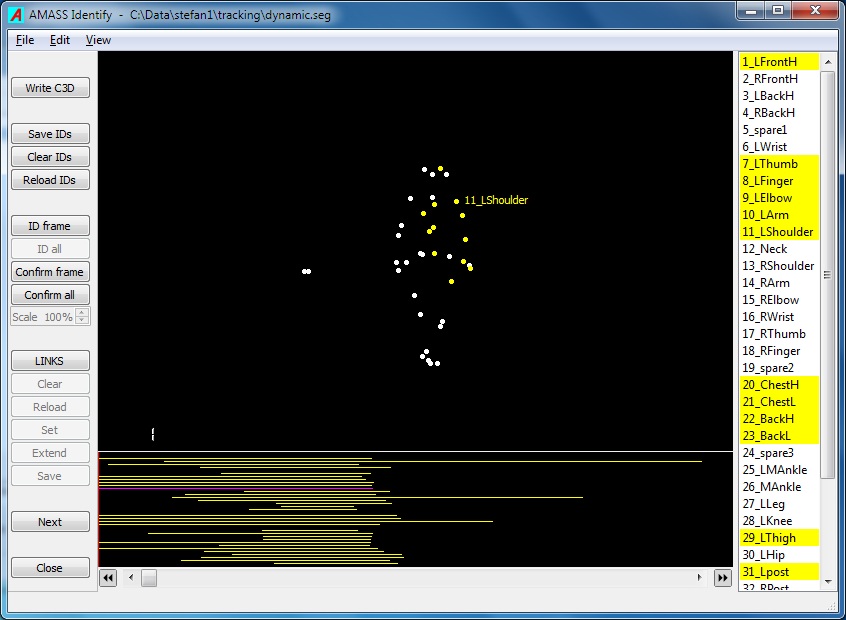
The Identify screen has four main areas. The control area on the left contains 17 buttons. The central area will be called the view area and it presents a 3D view of the tracked data for the current frame which can be selected by the slider at the bottom of the window.
Below the view area is the continuity area indicating the lengths (in frames) of labeled segments as horizontal lines. And on the right is the label area that list marker labels as read from the marker (.mrk) file.
Menu bar
Most commonly used commands are conveniently accessed in the control area, but some additional commands can be found in the main menu bar of the Identify window.
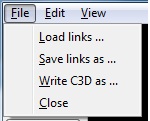
File
- Load links …
- The Identify program automatically loads the link file specified in the Identify parameters, but you may browse for and load another link file with this command.
- Save links as …
- The Identify program automatically saves links to the file specified in the Identify parameters, but you may save it with different name and to another location with this command.
- Write C3D as …
- The Write c3d button will save the identified data to the project c3d directory with the name of the input .seg file. Use this option if you wish to save the data to a different file.
Edit
- Links
- This command writes the current link data in memory to a temporary file and opens the file in NotePad for user inspection or editing. If it is closed with a Save then the link data in the Identify program are updated.
- Link color
- Use this command to choose a default color for created links.
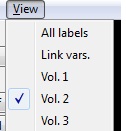
View
- Hidden Off
- An unidentified segment may be hidden (turned off from view) by Left double-clicking on any point belonging to that segment. All such hidden segments may be made visible again by clicking this command to display their points as unfilled circles. The item will then display as checked. If the item is already checked, clicking it will turn off from view all hidden segments (those displayed by unfilled circles).
- Hide UnIDd
- This command can be used to hide all segments that have not been labeled, and is convenient for cleaning up the view window after identification.
- Unhide All
- This command will unhide all hidden segments and cause them to be drawn in the view area.
- All labels
- Turns on display of labels for all points in the view area, not just the point under the cursor.
- Link vars.
- Colors the drawn links according to variations in link length as currently recorded. See Menu_commands.
- Vol. 1, Vol. 2, etc.
- Turns on/off the drawing of individual display volumes (see Identify parameters).
View area
The view area presents a 3D view of the points for a particular frame selected by use of the frame slider. Here we define a point as an instance of a segment at the time of the current frame. Note that not all points represent markers because the Track program may create “ghost markers” from the accidental intersection of rays from different sources. Also, a marker may not always result in a point, for example when it is not recorded by at least two cameras.
The Identify screen allows for the identification of segments by the association of marker labels with points. When you label a point in a frame, you are actually labeling the entire segment that contains that point.
In the view area unlabeled points are indicated by white solid circles, and identified (labeled) points are drawn in yellow. A label assigned to a point in the current frame will have its label background in the label area as yellow. Pausing the mouse cursor over a point will display the point’s segment number if it is unlabeled, or the assigned marker label if it is identified.
The following mouse actions are effective for manipulating the view area view:
- Left button drag horizontal; rotates the image about the pan-axis.
- Left button drag vertical; tilts the image about screen horizontal axis.
- Left + Right buttons drag; translates the image.
- Right button drag vertical; zooms the image.
The mouse button actions have the following effects:
- Left click on a point; used to assign a selected label to a point.
- Left double-click on a point;
- cancels the label assignment if the point is labeled
- hides the segment from view if point is unlabeled
- returns the segment to full view if it is hidden
- Right double-click on a point; translates that point to the center of the view coordinate system.
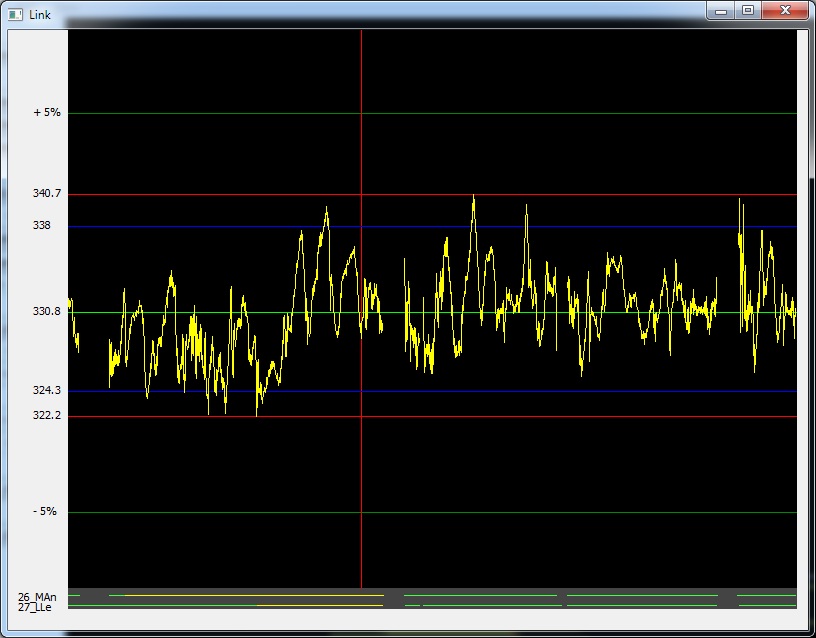
- Shift + Right click on two successive points; displays plot of link length between the points.
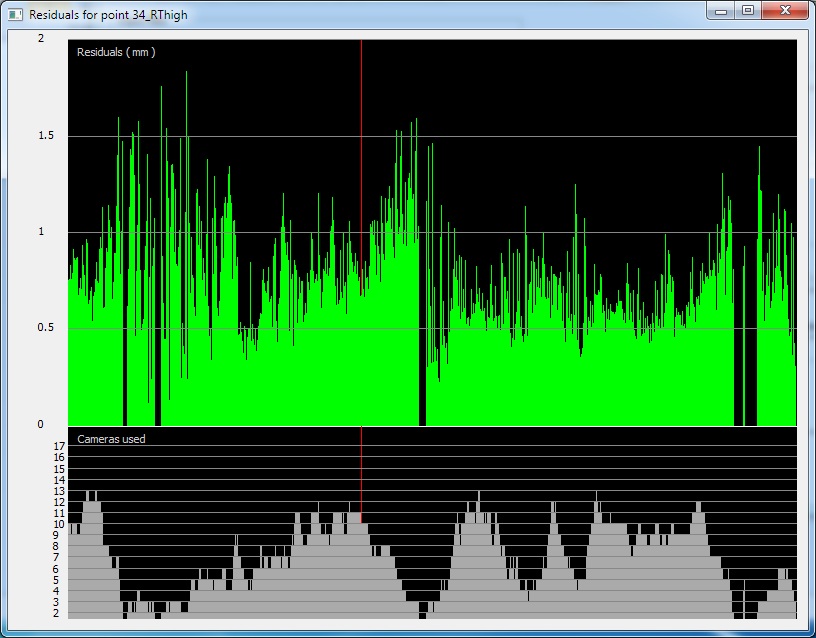
- Shift + Right double-click on point; displays a residual and cameras used plot for the point.
If LINK mode is on (see section xxx) we also have:
- Left click on labeled point; creates link to the previously Left clicked point.
- Right click on labeled point; creates links to all previously Right clicked points.
- Shift + Left click on link; displays color picker for the link.
- Shift + Left double-click on link; deletes the link.
Graphing residuals for a point
If you hold down the Shift key and Right double-click on a point in the View area, the program will display a plot of the average residuals for that point, over all frames, as well as the number of cameras that were used to measure that point, as shown next.
This capability is useful for checking the quality of the 3D data and calibration. If the selected segment is identified, the plot also shows data for all segments that have been given that label.
Graphing distances between point pairs
The program has a convenient utility to graph the separation of any two segments (identified or not) and visualize how much a link between them would vary in length. With the Shift key held down do a Right-click first on one point and then on a second point. A window will appear showing a plot of the distance between the two segments over all frames where they both are present. Also indicated will be the absolute minimum and maximum (in red), the mean distance (in green), and the +/- 5% lines about the mean (in light green). Blue lines indicate maximum and minimum exclusive of the extreme 2% of all separation values and are used as link limits for the ID all calculations. Note that the blue line values do not indicate the current link settings but show what we would get if the link was defined, and after doing a Set (links) . If the two segments are identified the plot also shows the distances between all other segments that are identified with the markers. The continuity plots for the segments are provided at the bottom of the window.
This facility is useful when defining links, and in displaying errors in segment identifications.
Continuity area
The strip below the View area has vertical space for every label shown in the Label area. If there too many labels to fit into the Label area the segments in the continuity area will scroll in conjunction with the labels in the Label area.
Holding the mouse cursor over an unidentified point in the View area will show the length of its segment (in magenta) in the first line of the Continuity area. If a point has been labeled its continuity will be graphed as a yellow line in a position corresponding to the label’s position in the Label area, and if the mouse cursor is moved over a labeled point its segment continuity will temporarily change to magenta. Note that both the magenta and yellow continuity lines may have light and dark sections which indicate breaks in segments that have been connected by the segment connection facility in the Track program.
By default each label is given a vertical space of three pixels. You may use the up and down arrow keys on the keyboard to increase or decrease the height devoted to the continuity area.
Label area
The Label area displays a list of all marker labels supplied in the marker (.mrk) file. It is used for selecting labels to apply to points, and by the color of each label’s background indicates the status of the point identifications in the current frame shown in the view area.
Frame slider
Below the Continuity area is a slider for selecting the frame of data to display in the View area. The frame counter is shown in the bottom left hand of the view area, and the frame’s position in the continuity area is indicated by a red vertical cursor line.
The frame slider may be moved by Left-clicking on the slider and dragging, or rotation of the mouse wheel. Each step of the mouse wheel changes the slider position by five frames. Also, Left-clicking in the slider area to the right (or left) of the slider button advances (or back steps) the frame count by 100 frames.
The two double arrow buttons at ends of the frame slider may be used to replay the point motions at the speed the data was recorded.
Setting output frames (Home/End keys)
The user can specify the frame range that is to be treated and output when writing the .c3d file. To set the start frame move the frame cursor to the frame where data output is to begin and press the Home key. To set the last frame move the frame cursor to the desired frame and press the End key. The areas outside the selected frame range will now be indicated by shading in the continuity area.
Control area button functions
- Write C3D
- Outputs all identified marker data to a .c3d file. Only data for markers up to the highest numbered marker label used are output. To write a file to a location other than the project c3d directory use the File/Write c3d as … command from the menu bar.
- Save IDs
- This button causes all current segment identifications to be saved to the input .seg file. Note that the identifications are saved in terms of the marker numbers as ordered in the marker Label area (and the input .mrk file), and not in terms of the label names themselves. If you reload the .seg file using a different .mrk file, Identify will apply the new marker labels to the labeled segments.
- Clear IDs
- Clears all segment labeling.
- Reload IDs
- Reads the identifications stored in the .seg file and overwrites any current segment labels with those from the .seg file.
The next eleven buttons pertain to Identifications using links and are described in that section.
- Next
- Closes the current identification session and restarts Identify using the next .seg file in the Input files list provided more than one .seg file was initially selected.
- Close
- Closes the Identify program and takes the user back to the AMASS shell.
