CalibrateDSX: The Importance of Image Smoothing and Downsampling
DRR-based tracking of bones in X-ray images relies heavily on the brightness of the bones' edges in the edge-detected images. Noise in the images, from scatter, cross-scatter, soft-tissue variability, and quantization, degrades the quality of these edges. Smoothing and/or downsampling the images during correction increases their signal-to-noise ratio, resulting in brighter edges. For more information about how downsampling reduces image noise, read [this explanation]. Some amount of smoothing or downsampling is almost always needed to maximize the trackability of the bones.
Smoothing CalibrateDSX uses a Guassian blur algorithm to perform smoothing. It convolves the image with a Gaussian distribution function, giving you the option of a 3x3, 5x5, or 7x7 convolution kernel, and the standard deviation of the function. For example, with a 3x3 kernel, each pixel is replaced by the weighted average of itself and its eight immediate neighbors. The higher the standard deviation (sigma), the greater the weights of the neighboring pixels, and thus the heavier the smoothing.
Downsampling Downsampling has a similar effect to smoothing because it combines pixel intensity values, but it also reduces the size of the output image. For example, resizing a 1000x1000 image using a scale factor of 0.5 creates a 500x500 output image. Each 2x2 block of pixels is replaced by a single pixel that is an average of the four pixels in the block. If the scale factor does not divide the image size evenly, a Lancos resampling algorithm is used to calculate the output pixel intensities. Because downsampling reduces the size of the X-ray images, it also increases the speed of automated tracking in X4D. DRR generation is one of the time-consuming components of tracking, and the time required to generate a DRR is directly proportional to the size of the X-ray image. It is recommended that you downsample your X-ray images as much as possible without losing the smaller features of the bones you are tracking. The optimal size also depends on the voxel size of your 3D image data. There's no point in highlighting fine detail in the X-ray images if this detail is not present in the DRRs because of relatively coarse voxels.
 Example: Knee

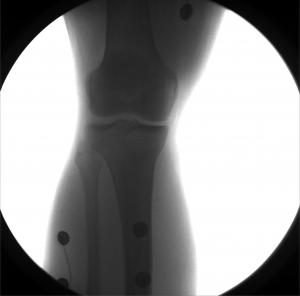
These images were captured at the Biodynamics Lab at the University of Pittsburgh. They are 14-bit grayscale with a resolution of 1824x1800 pixels. Smoothing these images is not as critical as it is with other joints because the cortical shells of the femur and tibia already provide fairly strong edges. But it will still strengthen the edges enough to make tracking easier. A 5x5 kernel and a sigma of 2.0 would be a good choice in this case. Resizing with a scale factor of 0.5 will not remove any trackable edges and will make tracking close to four times faster.
The following images are zoomed in on the joint to highlight the results of the filtering.
Left: Original image Right: Edge-detected image


Left: Smoothed (5x5 kernel, sigma = 2.0)
Right: Downsampled (scaled by 0.5 to 912x900)


Smoothed (5x5 kernel, sigma = 2.0) and downsampled (scaled by 0.5 to 912x900)

 Example: Cervical Spine

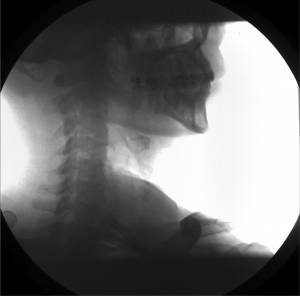
These images were captured at the Biodynamics Lab at the University of Pittsburgh. They are 14-bit grayscale with a resolution of 1824x1800 pixels. In the unmodified edge-detected image, the edges of the cervical vertebrae are barely visible, and their brightness is not sufficiently greater than the background to allow for automated tracking. For these images, smoothing with a 5x5 kernel and a sigma of 2.0, followed by a scaling of 0.5, produces the best results.
The following images are zoomed in on the vertebrae to highlight the results of the filtering.
Left: Original image Right: Edge-detected image


Left: Smoothed (5x5 kernel, sigma = 2.0)
Right: Downsampled (scaled by 0.5 to 912x900)


Smoothed (5x5 kernel, sigma = 2.0) and downsampled (scaled by 0.5 to 912x900)

 Example: Lumbar Spine

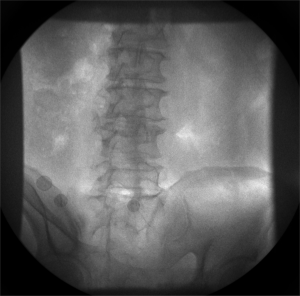
These images were captured at the Biodynamics Lab at the University of Pittsburgh. They are 14-bit grayscale with a resolution of 1824x1800 pixels. In the unmodified edge-detected image, the edges of the lumbar vertebrae are mostly indiscernible. Automated tracking would be impossible, and even manual tracking would be very difficult. For these images, smoothing with a 7x7 kernel and a sigma of 4.0, followed by a scaling of 0.33, produces the best results. Nevertheless, tracking the vertebrae in these images will be difficult because of the thinness of the cortical bone and the amount of soft tissue in the line of sight.
The following images are zoomed in on the vertebrae to highlight the results of the filtering.
Left: Original image Right: Edge-detected image


Left: Smoothed (7x7 kernel, sigma = 4.0)
Right: Downsampled (scaled by 0.33 to 608x600)


Smoothed (7x7 kernel, sigma = 4.0) and downsampled (scaled by 0.33 to 608x600)
