Event Labels
| Language: | English • français • italiano • português • español |
|---|
Movement data is often collected for more time that is required for the analysis. This is often done to minimize the effects of filtering at the endpoints. Sometimes it is because more than one cycle can be collected at a time or to ensure that the entire cycle is collected. Sometimes it is because there are long periods of meaningless activity between epochs. Regardless of the reasons for collecting extra data, it should not be necessary to analyze or report all of the data. The interval of interest must be extracted from the trial. The user must be able to define a time frame of interest. Most often the region of interest is defined by specific events, such as heel strike or toe off. This can be accomplished by editing the data file or by entering the start and end frame. This process is extremely tedious and in many circumstances can be automated.
An Event is simply an occurrence of interest that correlates to a motion capture frame, i.e. to a particular time point within a movement. The key events for gait studies (e.g., heel strike, toe-off) are now so well standardized that Visual3D can detect and mark them automatically . For other applications, you can define your own events, either manually (using the mouse to double-click on significant points on any graph) or computationally.
Note: Event Labels are part of the C3D format, and as such follow the rules of the format. The notable limitation of Event Labels is that they must occur at a Point frame. If an event is calculated from an Analog signal that happens to lie between two point frames, the nearest point frame is used.
Event_Commands
- Events Pipeline Commands
Event_Examples
- Events Examples
Tutorial: Event Processing
- Tutorial focused on Events
Range
A range is usually considered to be either the frames between and start event and an end event, or the frames described by an Event_Sequence
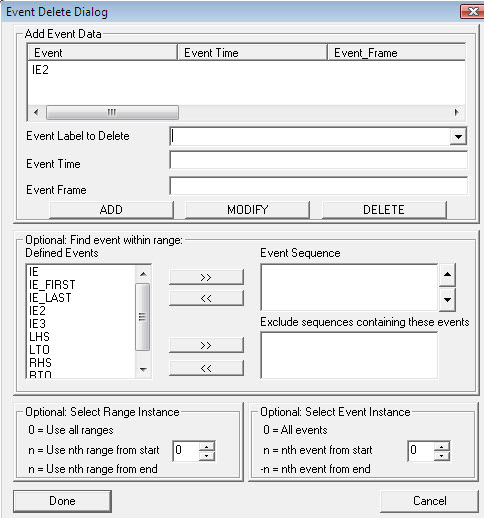
This dialog is a typical example of a dialog for defining ranges.
Event_Sequence
The parameter Event_Sequence is used in many of the Events and Metrics commands. This is an extension to defining a Start Event and Stop Event that indicate which frames should be processed.
For example
/Event_Sequence=RHS+LTO+LHS+RTO
Visual3D is looking for this series of events chronologically. Other events may exist in this range and be ignored when looking for the sequence.
If for example the events were created as RHS+RHS+LTO+LHS+RTO
The first RHS event would be ignored because the sequence did not follow exactly.
Exclude_Events
Any range that contains one of the exclude events is ignored.
This can be a useful way to remove an unwanted range from inclusion. This could be a range in which a perturbation occurred or there was some problem with the marker tracking.
Consider a trial of running on a treadmill that has many occurrences of heel strike and toe off.
For example,
The Event_Sequence might be: /Event_Sequence=RHS+RTO+LHS+LTO
If /Exclude_Events=BAD
any range satisfying the Event_Sequence that also contains the Event Label BAD anywhere in the range would be ignored.
Event_Instance
Visual3D allows multiple Event Labels of the same name.
Event_Instance allows you to identify a specific event in the trial.
- Event_Instance=0 indicates that all events should be used
- Event_Instance=n indicates that the nth event should be used
- Event_Instance=-n indicates the the nth event from the end should be used. e.g. -1 indicates the last event.
Range_Instance
An Event_Sequence is referred to as a Range
- Range_Instance=0 -> use all instances of the Range
- Range_Instance=n -> use the nth instance of the Range
- if n<1 count instances from the last Range; e.g. -1 = last range
Entering an Event manually
SIGNAL AND EVENT PROCESSING: Creating an Event Label Manually
Events can be added to the data file manually by selecting a frame in a graph in SIGNAL AND EVENT PROCESSING mode.
First, switch to Signal and Event Processing mode, expand the data tree to find the signal that you want graphed. Selecting the signal name with the Right Mouse Button will popup a menu for graphing the signal.
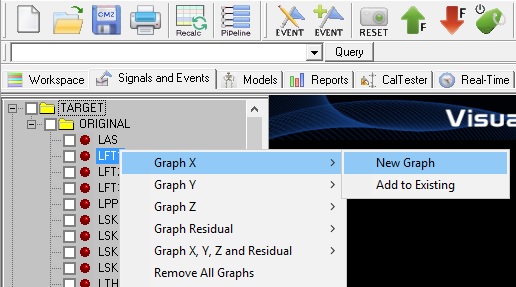
Select the graph by clicking with the Left Mouse Button on the graph. When the graph is selected you will see the handles (little rectangles) on the graph.
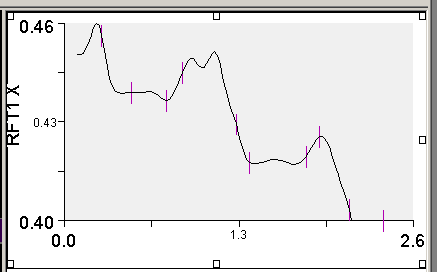
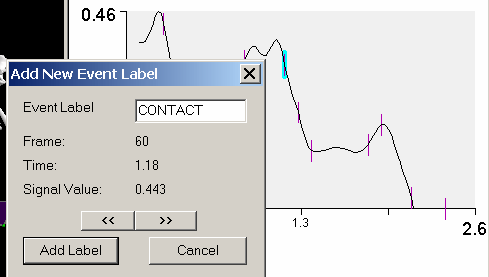
Note that the small vertical bars on the signal represent the times of Event Labels that have already been created. To create a new Event Label, double click with the Left Mouse Button at approximately the location you want the Event to be added. A dialog will popup that will allow you to name the Event Label. Note that the name of the Event Label can be the same as an existing label in the data tree because more than one occurrence of an Event is allowed.
The buttons << and >> allow you to move the Event forward or backward through the frames. After an Event has been created it can be edited using the Edit Events Dialog. The process of Editing an Event is explained elsewhere.
Events can also be added manually from the a Pipeline Command.
- Event_Explicit
- /Event_Name=
- /Frame=
- /Time=
- :
Deleting All Events
Select the Events:ORIGINAL folder in the data tree using the right mouse button. Select the option to "delete folder". Note that this will delete the folder in all files that are active. If ALL_FILES are active, all Event folders will be deleted.
Editing an Event Label
Toolbar: Edit Event Labels
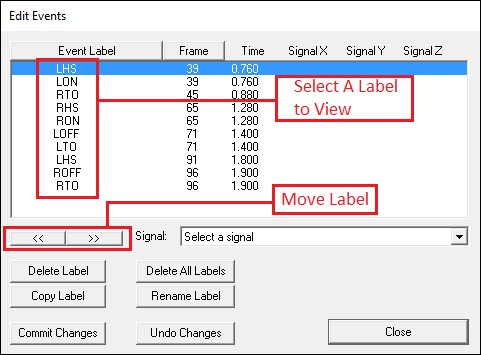
There is an Icon at the far right side of the Toolbar which brings up the edit events dialog.
All event labels can be modified under visual inspection. Selecting an event label will show the event in the interactive graph display, and will freeze the animation window at the corresponding event.
