Export Results
| Language: | English • français • italiano • português • español |
|---|
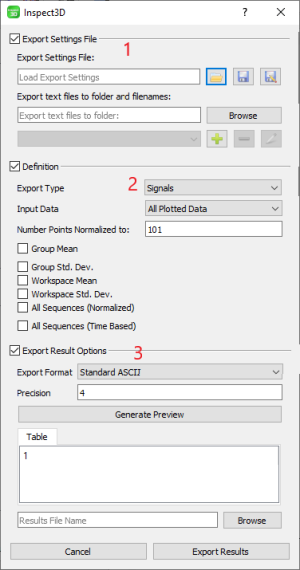
Inspect3D's Export Results dialog contains three sections.
1. The Export Settings File (see 1) allows the user to load or save export settings so that they can be applied to future analysis.
2. The Definition section (see 2) allows the user to define which results will be exported. There are three export types that can be defined: Signals, Metrics, and PCA Results.
3. The Export Results Options section (see 3) allows the user to specify how the results will be exported. It is also possible to preview the export before saving it to text.
Export Settings File
The Export Settings File section allows users to specify multiple export settings at once and to save these export settings to an .e3d file for reuse.
- Export Settings File: Select an .e3d file from which to load export settings and save the current settings to the specified file.
- Export test files to folder and filenames: Specify the folder where results files will be saved; add, remove, and rename individual results files.
Definition
The Definition section is where the user defines which data should be exported. This begins by specifying the type of export, either Signals, Metrics or PCA results, each of which gives the user further options. The user is also able to select which data to export: All Queried Data, All Plotted Data, Active Plot Data, or All Highlighted Data.
Signals
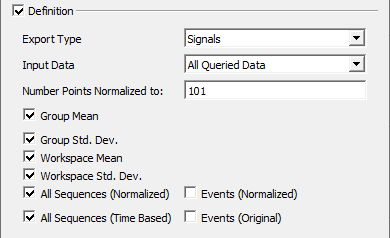
The Signals option exports previously defined waveforms. The user controls the Number of Points that will be used to normalize the data; the default setting is 101. The types of data that can be exported include both individual and group data as well as raw and processed data. The five options, including the header information for each export type, are:
1. Group Mean: Exports the normalized mean for the defined group (a group corresponds to a single query). The exported file will contain the normalized mean for each group. The normalized mean for each workspace is taken, and mean is taken across the workspace means.
2. Group Std. Dev.: Exports the standard deviation for the group using the mean workspace curves as the input data (ie. N = the number of workspaces/CMZ files contained within the group). The normalized mean for each workspace is taken, and the standard deviation is taken across the workspace means.
3. Workspace Mean: Exports the normalized mean data for each workspace in each of the groups.
4. Workspace Std. Dev.: Exports the standard deviation for each workspace in each of the groups.
5. All Sequences (Normalized): Exports the normalized data for each trace for every workspace in each of the groups.
5.1 Events (Normalised): This option becomes visible when All Sequences (Normalized) is selected. It exports the normalized events that occur within this sequence (intermediate events). The data is normalized to the percentage of the signals.
6. All Sequences (Time Based): Exports the time based (un-normalized) data for each trace for every workspace in each of the groups.
6.1 Events (Original): This option becomes visible when All Sequences (Time Based) is selected. This exports the normalized (to 101 points) events that occur within this sequence.
Metrics
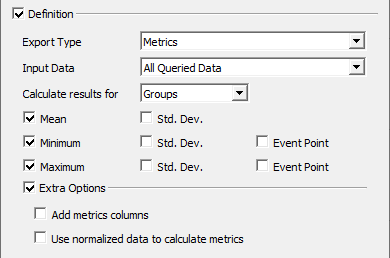
The second export type is Metrics. This export type is useful when certain aspects of a waveform, such as the minimum or the maximum, are desired and not the entire waveform. The Calculate results for drop-down menu allows the user to specify whether these metrics should be calculated on the basis of Groups, Workspaces, or Instances. This is important since the interpretation of mean and standard deviation values changes depending on what these values represent.
- If the 'Groups' option is selected then the chosen metrics are calculated for each workspace in the group using the mean waveform for each workspace as the input data. The mean value of these workspace-level metrics is then calculated and reported for the group.
- If the 'Workspaces' option is selected then the chosen metrics are calculated for each workspace in the group using the mean waveform for each workspace as the input data.
- If the 'Instances' option is selected then the chosen metrics are calculated for each trace in each of the group's workspaces, using the individual traces as input data.
The user can also specify which metrics to export:
1. Mean: Calculates and exports the mean value(s).
1.1. Std. Dev.: Calculates and exports the standard deviation about the selected metric.
2. Min: Calculates and exports the minimum value.
2.1. Std. Dev.: Calculates and exports the standard deviation about the minimum point.
2.2. Event Point: Calculates and exports the position(s) (index) of the minimum value.
3. Max: Calculates and exports the maximum value.
3.1. Std. Dev.: Calculates and exports the standard deviation about the maximum point.
3.2. Event Point: Calculates and exports the position(s) (index) of the minimum value.
4. Add Metrics Columns: Adds and removes additional columns of metrics to the export.
5. Use normalized data to calculate metrics: If checked, then the input data is normalized before calculating the specified metrics.
PCA Results
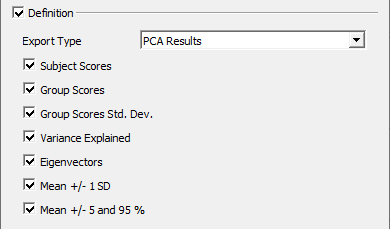
PCA Results allows the user to export results from Principal Component Analysis (PCA) calculations. PCA Results must exist before they can be exported.
1. Subject Scores: This exports the mean workspace scores for each group. The number of values exported is equal to the number of PCs selected.
2. Group Scores: This exports the mean group scores for each group. The number of values exported is equal to the number of PCs selected.
3. Group Score Std. Dev: This exports the standard error for each group. The number of points is equal to the number of PCs used in the analysis.
4. Variance Explained: This exports the variance explained (as a percentage of the total variance) by each principal component.
5. Eigenvectors: This exports the eigenvectors for each PC. The number of points exported is 101 and the number of signals depends on the number of PCs used in the analysis.
6. Mean +/- 1 SD: This exports the mean group score plus and minus one standard deviation for each group. The number of values exported is equal to the number of PCs selected.
7. Mean +- 5 and 95%: This exports the 5th and 95th percentile score for each group. The number of values exported is equal to the number of PCs selected.
Export Result Options
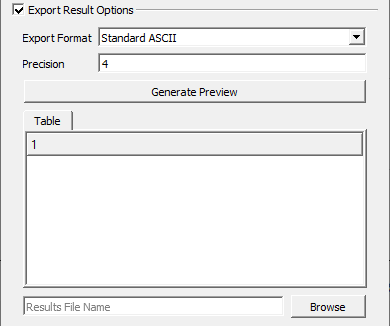
1. Export Format: Specifies the formatting for the text file. Options are:
1.1 Standard ASCII, exports the signals in a row centric format.
1.2 Transposed ASCII, exports the signals in a column centric format.
1.3 SPSS ASCII, allows the exported file to be read by SPSS.
1.4 P2D, which is a legacy file format from the MOVE3D software application.
2. Precision: Specifies the number of digits after the decimal to include for the text file export. This preview is identical to the format of the file that will be exported.
3. Generate Preview: Populates the Table with a preview of the export results according to the dialog's current settings.
4. Results File Name: Allows the user to specify the path to the export results file.
