Inspect3D Documentation Options Dialogue
| Language: | English • français • italiano • português • español |
|---|
Options
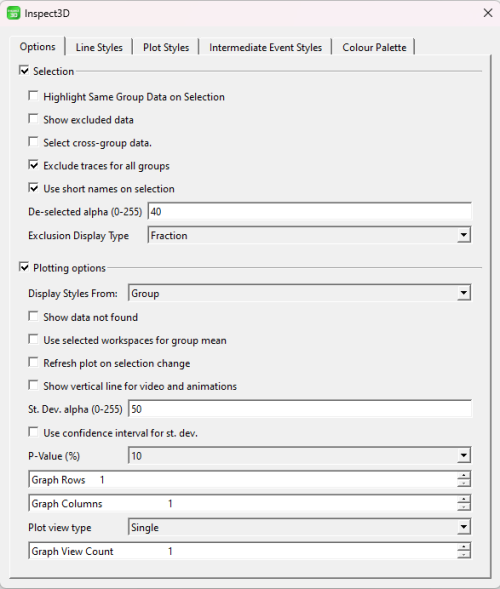
The Selection and Plotting Options sections can be expanded and collapsed using the check boxes beside the section headings.
Selection
Highlight Same Group Data on Selection - When the Highlight Same Group Data on Selection check box is selected and user selects a line of data from the graph, all of the data from the subject within the query will be selected. If the check box is not selected only the line of data that was clicked on will become selected.
Show excluded data - The Show excluded data check box adds any data that has been excluded to the graph when it is selected. if the check box is not selected then the lines remain hidden.
Select cross-group data - When Select cross-group data is selected it allows the user to click on a data line and if there is data from the same subject and frame period in a different group that line will also be highlighted.
Exclude traces for all groups - The Exclude traces for all groups check box allows the user to exclude all the lines of data for a particular subject and frame period across all of the groups.
Use short names on selection - If the Use short name on selection check box is selected then the group name, .cmo file name, .c3d file name, and the frame range will be shown when a line on the plot is selected. If it is not selected then the .c3d file path will be given instead of just the file name.
De-selected alpha (0-255) - The De-selected alpha sets the transparency level of the lines that are not selected on the graph.
Exclusion Display Type - The Exclusion Display Type shows how much of a participant's data has not been excluded next to the subject in the Group Subjects list. The options are None, Fraction, and Percentage.
Plotting options
Display Styles from - This can be set to Group, Workspace, Sub-Group or Cluster. When set to Group the colours of the lines on the graph will be based on the colour query group that the line belongs to. When set to Workspace the colours of the lines on the graph will be based on the colour of the Workspace that the line belongs to, and so on. This dropdown menu is duplicated under the Line Styles tab. Changes to one Display Styles from dropdown will synchronously update the other. After choosing a style to display, hit Refresh Plot in the I3D workspace to apply changes.
Show data not found - When the Show data not found is checked then data that is missing from the .cmo file will be graphed as -999 999.0. If the check box is left unchecked data with a value of -999 999.0 will be ignored.
Auto-scale graphs - When the Auto-scale graphs check box is selected the graph will be adjusted so that all of the lines on the graph are aligned with the edges of the graph.
Use selected subjects for group mean - When the Use selected subjects for group mean check box is selected only the subjects who are selected on the left will be used in the group mean calculations.
Refresh plot on selection change - When the Refresh plot on selection change check box is selected the general graph will update as soon as check boxes to plot means, standard deviations, and raw data are selected and deselected. If the check box remains unselected the user must click on the Refresh Plot button at the bottom of the graph section in order to refresh the selected graph.
Show vertical line for video and animations - When the Show vertical line for video and animation check box is selected and an animation or video is playing (either from the Video button or the Animation Button) a line will appear on the general graph to indicate the position of the video/animation relative to the data on the graph.
St. Dev. alpha (0-255) - The standard deviation alpha sets the transparency of the standard deviation area when it is graphed.
Use confidence interval for st. dev. - The Use confidence interval for st. dev. check box uses the confidence interval instead of the standard deviation for the graphs in the general graph section.
P-Value (%) - The P-Value drop down controls the thickness of the confidence interval on the general graph. The options for the drop down menu include 1%, 5%, and 10%.
Graph Rows - The Graph Rows counter controls how many rows of graphs are in the general graphs section.
Graph Columns - The Graph Columns counter controls how many columns of graphs are in the general graphs section.
Plot view type - The Plot view type allows the user to control the settings of the Show Graphs drop down menu. The options are Single, Row and Column. The Single option sets the drop down to list Graph n,n which, when selected will bring that Graph to full screen. The Row option sets the drop down list to Row 1, Row 2, ... Row n, which when selected limits the graphs to the graphs in the chosen row. The Column option sets the drop down list to Column 1, Column 2, ... Column n, which when selected limits the graphs to the graphs in the chosen column.
Graph View Count - The Graph View Count allows the user to group rows of graphs together. For example, if there are 4 rows of graphs and the Graph View count is set to 2 the Show Graphs drop down will have Row 1,2 and Row 3,4 and when double clicking on the graphs in row 1 or 2 both rows will be shown.
Line Style
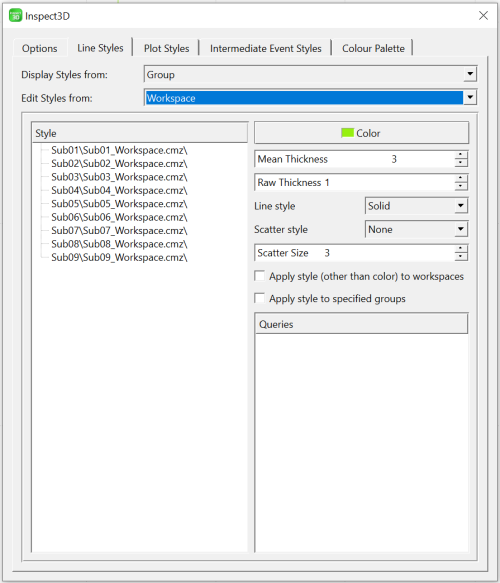
The style section of the dialogue box allows the user to change the style of both the group, subject, or condition lines. The user selects the lines that they wish to alter by selecting either Group, Subject or Condition in the drop down menu at the top of the tab.
Display Styles From - This can be set to Group, Workspace, Sub-Group or Cluster. When set to Group the colours of the lines on the graph will be based on the colour query group that the line belongs to. When set to Workspace the colours of the lines on the graph will be based on the colour of the Workspace that the line belongs to, and so on. This dropdown menu is duplicated under the Line Styles tab. Changes to one Display Styles from dropdown will synchronously update the other. After choosing a style to display, hit Refresh Plot in the I3D workspace to apply changes.
Edit Styles From - The style list shows the user all of the Groups, Workspaces, Sub-Groups, Clusters, Exclusions, or Vertical Lines that can be edited the workspace. Select the feature you want to edit to alter the colors, line or scatter size.
Color - This button opens the standard color dialogue and allows the user to change the color of the groups that are selected. The change will appear both next to the group name and on the graphs.
Mean Thickness - The mean thickness controls the thickness of the Plot Group Mean and Plot Subject Mean lines on the graph. The line thickness can be set between 0 and 20.
Raw Thickness - The raw thickness controls the thickness of the Plot Subj Raw lines on the graph. The line thickness can be set between 0 and 20.
Line Style - The line style controls the line style of the Plot Group Mean, Plot Subject Mean, and Plot Subj Raw lines on the graph. The lines can be set to None, Solid and Dotted.
Scatter Style - The scatter style places scatter plots along the lines for the Plot Group Mean, Plot Subject Mean, and Plot Subj Raw lines on the graph. The scatter style can be set to any of the following: None, Dot, Cross, Circle, Disk, Square, Diamond, and Star.
Scatter Size - The scatter size controls the size of the scatter and can be set between 0 and 20.
Apply style (other than color) to subjects - When the Apply style to subjects/groups checkbox is selected and Apply Changes is clicked then all of the style changes except the color will be applied to either all the subjects or groups.
Plot Style
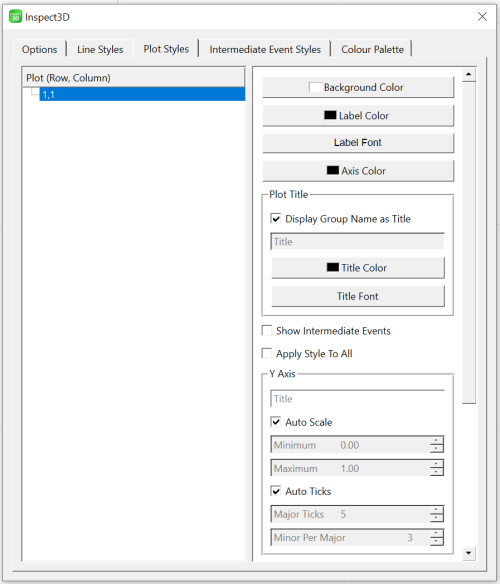
Plot List - The Plot List has a list of all the plots that are in the general graphs area. They are designated by row and column number. The Plot that is selected is the plot that will be affected.
Colors
Background Color - This button opens a standard colour dialogue and changes the colour of the background of the graph.
Label Color - This button changes opens a standard colour dialogue and changes the colour of the axis labels.
Label Font - This button opens a standard font dialogue and changes the font, font style, size, effects and writing system of the labels.
Axis Color - This button pens a standard colour dialogue and changes the colour of the axis.
X and Y Axis Sections
Title Box - These title boxes allow the user to change the labels of the x and y axis.
Minimum - These number boxes allow the users to change the minimum value on the x and y axis.
Maximum - These number boxes allow the users to change the maximum values on the x and y axis.
Normalize X Data - If this checkbox is selected the data on the X-Axis will be normalized from 0 to 100. This checkbox is only available in the X-Axis section of the dialogue box.
Auto Ticks - If this checkbox is selected the ticks - or markers - on the axis will be automatically generated. When this checkbox is selected the Major Ticks and Minor per major options are inactive.
Major Ticks - For this option to be active the Auto Ticks checkbox must be deselected. The Major Ticks counter allows the user to increase or decrease the number of ticks - or markers - with numbers are along the axis.
Minor per major - For this option to be active the Auto Ticks checkbox must be deselected. The Minor per major counter controls how many smaller ticks are between the major ticks with numbers.
Other
Show intermediate events - If this checkbox is selected the intermediate events will be shown on the x axis.
Apply style to all - When the Apply style to all checkbox is selected and Apply Changes is clicked then all of the style changes will be applied to either all of the plots.
Intermediate Event Styles
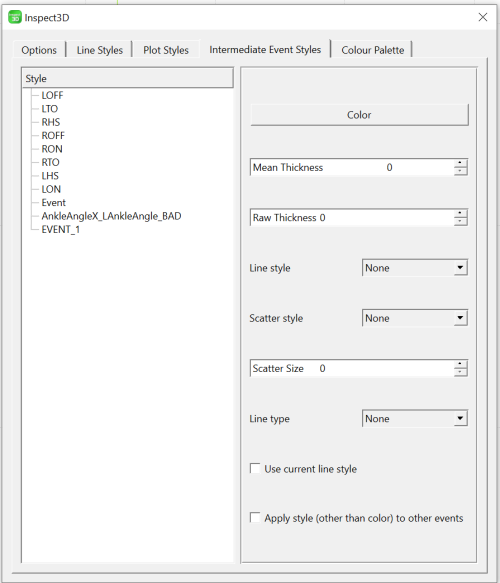
Style List - This list contains all the events in all the c3d files of the loaded library.
Color - This button opens a dialogue that allows the user to set the color of the lines and scatter plots.
Mean Thickness - The mean thickness controls the thickness of the mean lines on the graph. The line thickness can be set between 0 and 20.
Raw Thickness - The raw thickness controls the thickness of the raw lines on the graph. The line thickness can be set between 0 and 20.
Line style - The line style controls the line style for all of the lines on the graph. The lines can be set to None, Solid, Dash Dot, Dash, Dot, and Dash Dot Dot.
Scatter style - The scatter style places scatter plots on the lines for the events listed in the Style List. The scatter style can be set to any of the following: None, Circle, Cross, Cross Circle, Cross Square, Diamond, Disk, Dot, Peace, Plus, Plus Circle, Plus Square, Star, Square, Triangle, and Triangle Inverted.
Scatter Size - The scatter size controls the size of the scatter and can be set between 0 and 20.
Line type - The Line type controls the type of all the lines on the graph. The options are None, Short top, Point, Long, and Short bottom.
Use current line style - The Use current line style checkbox controls if the line style currently selected is applied to the other lines.
Apply style (other than color) to other events - The Apply style to other events check box allows all the settings, except the colour, to all of the other events in the Style List.
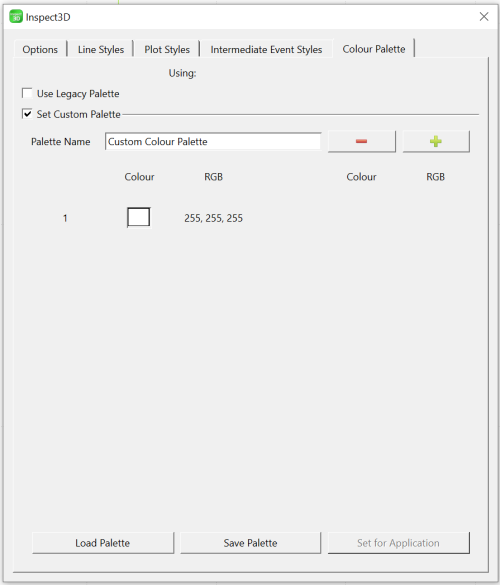
Color Palette
Use Legacy Palette - Default color palette.
Set Custom Palette - Allows you to select colors for a custom palette.
Load Palette - Opens a window for you to browse for a palette files (.xml).
Save Palette - Allows you to save your custom palette to your PC.
Set For Application - Set's the color palette to the settings specified in the loaded color palette.
