Normative Data From CMO Library
| Language: | English • français • italiano • português • español |
|---|
Building a database of "control" values takes place in four steps:
- Organize & Catalog the CMZ files
- Create a script to define the signals we want to create normal signals for.
- Create the normal database.
- Save the normal database for use in the future.
Sample Files
You can download the sample files for this example here.
The downloaded file contains:
- 1. A sample CMO library containing two CMO files (Sub01_Walk.cmo & Sub02_Walk.cmo) (These CMO files should work the same as CMZ files)
- 2. A sample report template (SampleReport.rgt)
- 3. A sample script to create a normal database (SampleScript.v3s)
- 4. A sample normal database (NormalDatabase.vnd)
Note: Visual3D now uses the updated and improved CMZ format, which will work identically for the purposes of this example.
Step 1: Organize & Catalog the CMO files
The first time you load the CMZ (CMO) library, you must organize the files. You do not need to do this each time you load the CMZ Library, however, if you move the CMZ files to different locations on your computer, this section should be done again.

1. Organize all the CMZ files that you intend to query from into folders within a hierarchy.
If using the sample files, you must unzip the file. You will see the CMO files in the CMO_Lib folder.
NOTE The CMZ files can be in subfolders as well.

2.Set Visual3D to point to the CMZ Library (CMO Library -> Set CMO Library Path).
If using the sample files, point to the CMO_Lib folder.

3. Catalog the Library (CMO Library -> Maintenance -> Catalog CMO Files).
NOTE: When you select "Catalog CMO Files", Visual3D goes through all the CMZ files, and ensures that the CMX file is up to date with the CMZ file. If you have not deleted your CMX files, or moved the CMZ/CMX files to different locations, you do not need to do this. Typically, I recommend cataloging the CMZ files the first time you use the library.
Step 2: Creating a script to define the signals in the normal database
Option 1: Using a Premade Pipeline
If you already have a premade pipeline, you can skip ahead to Step 3.
Note: If you are using a premade pipeline any variables you wish to save in the .vnd file needs to be saved using the Global_Normalized_Signal_Mean.
- Global_Normalized_Signal_Mean
- /SIGNAL_TYPES=LINK_MODEL_BASED+LINK_MODEL_BASED
- /SIGNAL_NAMES=RKNEE_ANGLE+LKNEE_ANGLE
- /SIGNAL_FOLDER=ORIGINAL+ORIGINAL
- /SIGNAL_COMPONENTS=X+X
- /START_LABEL=
- /END_LABEL=
- /EVENT_SEQUENCE= RHS+RHS++LHS+LHS
- ! /EXCLUDE_EVENTS=
- /RESULT_NAME=KNEE_FLEXION
- ! /RESULT_FOLDER=ORIGINAL
- /NORMALIZE_POINTS=101
- /CREATE_STANDARD_DEVIATION=TRUE
- ! /CALCULATE_PER_FILE=FALSE
- ;
Option 2: Creating Script based off a Report Template
To automatically create the script, follow the instructions below, you will need a report template:
1. Load a report template. You can do this two ways:
- A. Open a CMO that has the report/graph of the values you wish to create ”normal” data for.
- You can open one of the example CMO files
- B. Open a report template that contains the data values you wish to create ”normal” data for.
- You can open the sample report template (SampleReport.rgt)
- Note: If you are following the Gait Profile Score Tutorial the use this report template.
2. Create script:
- 1. Select from the main menu: CMO Library -> Create Normal Database Script.

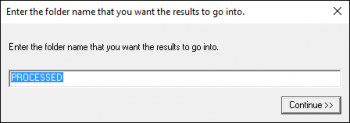
- 2. In the pop up window:
- A. Specify the name of a folder to save the data (ex. PROCESSED)
- NOTE: If you are going to plot two normal databases in one CMZ file (ex. Walk and Run), you should name the different folders "WALK" and "RUN" here.

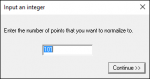
- B. Specify the number of points to normalize to (ex. 101)
- NOTE: Typically this would match the number of points you normalize your graphs to in the report template (Normalize 0 to 100%) so 101 points is used most often.

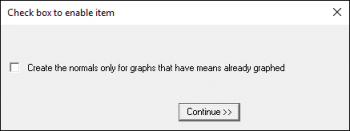
- C. Create normals/means for all the graphs in the report (optionally, use only those graphs that have mean values graphed).

3. View the created script in the Pipeline.
- There will be one command in the pipeline for every graph item in the report (or every one with a mean graphed if that option was selected). This means if you want to average the right/left together, you will need to modify the script to do this.
- Note: Running this wizard will create the command "Global_Normalized_Signal_Mean” and fill in the parameters for you whether you have the pipeline dialog open or not. Any time you choose to create this script automatically, it will append the results to anything that is in the pipeline workshop.

4. Save the Pipeline script.
We have now defined what we want to create normal values for. The normal data has NOT been created yet. So now we need to clear the workspace and load the raw data for this script. This will be accomplished in the next step.
Note: An alternative to the Wizard approach is to create/edit the command from pipeline directly using the Global_Normalized_Signal_Mean command. Note that the wizard added the desired data to the list at the bottom of the Global_Normalized_Signal_Mean command dialog box. You can enter and ADD new values here as well.
Step 3: Create the normal database
1. Clear out the entire Visual3D workspace
- (File -> New, or restart Visual3D)

2. Browse the CMO Library.
- From the main menu, select CMO Library -> Browse.

3. Set the Active File to EACH_CMO_WORKSPACE
- To select only specific files, create a new Tag, check the files to use, and select the tag name in the combo box.

4. Execute the script to create the normal database
- To select only specific files, create a new Tag, check the files to use, and select the tag name in the combo box.
- Execute the script that was saved earlier.
Step 4: Save the normal database
1. Check that the P2D signals were created.

- 1. Switch to Signal and Event Processing tab.
- 2. Set the Active File to GLOBAL
- 3. Expand the P2D folder
- 4. Expand the sub folder (ex. PROCESSED)
- 5. Click on a signal (ex. LAnkleAngle_X_LHS_LHS)
- You will see the P2D Data tree and the newly processed data there. Looking at the data view reveals that:
- Column 1 (X) is the number of data points requested
- Column 2 (Y) is the mean
- Column 3 (Z) is the standard deviation.
Note: The P2D format is simply a historical format for 2D point data storage, and is maintained to provide backward compatibility.
2. Save the Normal Data as a ”Normal” database. You can save the normal database as a .vnd file, or a .cmo file.

- To save as a .vnd file:
- Set the active file to GLOBAL
- Go to the Signals and Events tab
- Right-click on the folder name (ex. PROCESSED)
- Select Export Folder to Normal Database (.vnd)
- To save as a .cmz file:
- Close the CMO Library by going to CMO Library -> Unload CMO Library (Unbrowse)
- Save the workspace as a CMZ file (File -> Save)