Reporting Example 4
Jump to navigation
Jump to search
| Language: | English • français • italiano • português • español |
|---|
Adding an annotation at an explicit value along the x-axis
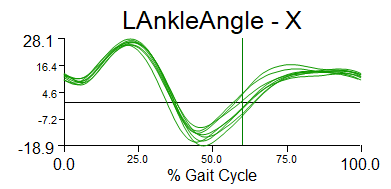
The following steps will add a vertical line (annotation) onto a report graph at 60% of the range.
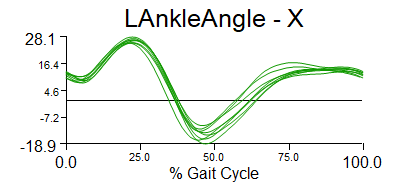
Given the following report graph:
Step 1 - Edit the Report Graph
|
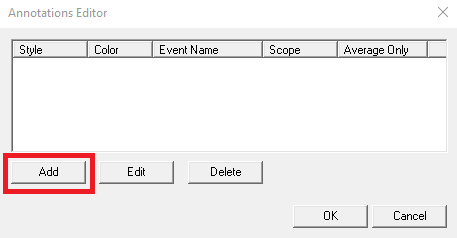
Step 2 - Select Annotations
|
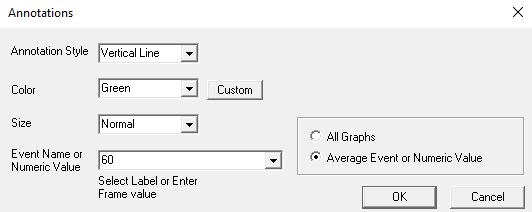
Step 3 - Select "Average Event or Numeric Value"
|
For a line at 60% along the x-axis, enter 60 in the combo box:
|
Review Resulting Graph
The resulting report graph:


