Sift - Export Results Dialog
| Language: | English • français • italiano • português • español |
|---|
The export results dialog allows the user to export a variety of data (group data, summary statistics, registered curves, Principal Component Analysis (PCA) results, Dynamic Time Warping (DTW) results and Statistical Parametric Mapping (SPM) results) to text files in Standard ASCII, Transposed ASCII, SPSS ASCII and P2D format. The export results dialog ![]() can be found on the toolbar and under the Export menu.
can be found on the toolbar and under the Export menu.
Export Results Overview
The export results dialog is split up into three sections.
- Export Settings
- Definition
- Export Results Options
Export Settings

Selecting export settings allows you to save premade selections for exporting, saving time customizing your exports. Export setting files are saved as standard text file.
Export Settings File: Here you can browse your library to load in an Export Settings File.
Export text files to folder and filenames: Here you can customize where you want your exports to be saved and specify the folder and the filenames.
Definition
This section is defining what you want to be exported in the text file. Changing the export type, changes the different options to be exported.
Export Type Data

The export type data allows you to export all information related to queries.
Input Data: This allows you to choose what data you want to be exported. There are four different options.
- All Queried Data - this will export all queries
- All Plotted Data - this will export data that is on any number of plots
- Active Plot Data - this will only export data that is on the active plot
- Highlighted Data - this will only export data that is highlight
All Workspaces in Group or Selected Workspaces: Choosing Selected Workspaces will only export workspaces that are selected in the groups and workspaces widget.
Number Points Normalized to: This will normalize the data to the number selected. The standard it to keep is at 101, which queries are typically normalized to.
Group Mean: Checking this box will export the groups mean.
Group Std. Dev.: Checking this box will export the groups standard deviation.
Workspace Mean: Checking this box will export the workspaces mean.
Workspace Std. Dev.: Checking this box will export the workspace standard deviation.
All Sequences (Normalized): Checking this box will export each normalized trace within the selected groups. This option also allows you to export the Events (Normalized), which exports the occurrence of each event within the signal.
All Sequences (Time Based): Checking this box will export each raw trace within the selected groups. This option also allows you to export the Events (Time Based), which exports the occurrence of each event within the signal.
Export Type Summary Statistics

The export type data allows you to export all information related to queries.
Input Data: This allows you to choose what data you want to be exported. There are four different options.
- All Queried Data - this will export all queries
- All Plotted Data - this will export data that is on any number of plots
- Active Plot Data - this will only export data that is on the active plot
- Highlighted Data - this will only export data that is highlight
All Workspaces in Group or Selected Workspaces: Choosing Selected Workspaces will only export workspaces that are selected in the groups and workspaces widget.
Calculate results for: This allows you to choose what you want the summary statistics to be calculated for. There are three options.
- Groups
- Workspaces
- Instances
Mean: This calculates the means of the data you chose. Checking this box also allows you to calculate the Std. Dev. of the means.
Minimum: This calculates the minimums of the data you chose. Checking this box also allows you to calculate the Std. Dev. of the minimums, and to export the Event Point of the minimums.
Maximum: This calculates the maximums of the data you chose. Checking this box also allows you to calculate the Std. Dev. of the maximums, and to export the Event Point of the maximums.
Extra Options: Checking extra option will only give results if previous options are checked, however this allows you the option to Add metric columns, and to Use normalized data to calculate metrics.
Export Type PCA Results

This option allows you to export PCA results.
Workspaces Scores: This will export the workspace score for each groups workspace run in the PCA.
Group Scores: This will export the group score for each group run in the PCA.
Group Scores Std. Dev.: This will export the standard deviation of the group score for each group run in the PCA.
Variance Explained: This will export the variance explained for each PC run in the PCA.
Eigenvectors: This will export the data points of the eigenvectors for each PC.
Mean +/- 1 SD: This will export the mean and +/- 1 standard deviation of the reconstructed PCs.
Mean +/- 5 and 95%: This will export the mean, the 5th and the 95th reconstruction of the PC.
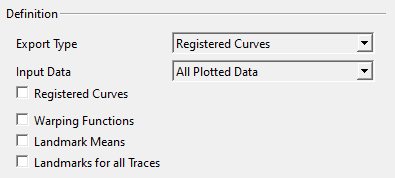
Export Type Registered Curves

This option will allow you to export all the information related to curve registration.
Input Data: This allows you to choose what data you want to be exported. There are four different options.
- All Queried Data - this will export all queries
- All Plotted Data - this will export data that is on any number of plots
- Active Plot Data - this will only export data that is on the active plot
- Highlighted Data - this will only export data that is highlight
Registered Curves: Checking this box will export all the traces of the registered groups.
Warping Functions: Checking this box will export the warping function for each trace in the registered groups.
Landmark Means: Checking this box will export the mean locations of the landmarks the groups were registered to.
Landmarks for all Traces: Checking this box will export the original location of each landmark for each trace.
Export Type Dynamic Time Warping

This option will export the results from DTW.
Found Anomalies/Traces: Checking this box will export the traces that were found in DTW.
Cost Functions: Checking this box will export the cost functions of the traces that were found in DTW.
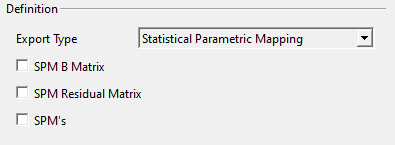
Export Type Statistical Parametric Mapping

SPM B Matrix: This will export the traces in the B plot.
SPM Residual Matrix: This will export the traces in the Residuals plot.
SPM's: This will export the SPM curve.
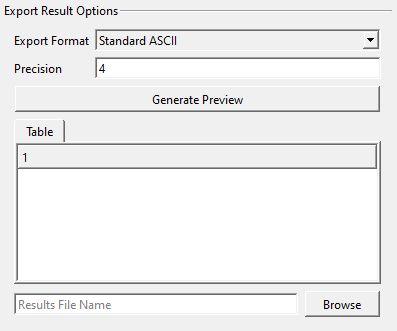
Export Result Options

This section allows you to customize how you want the data to look in the exports and to show a preview.
Export Format: This allows you to pick the format of the text file you want. There are four types of formats.
- Standard ASCII
- Transposed ASCII
- SPSS ASCII
- P2D
Precision: This is the number of digits after the decimal point.
Generate Preview: Pressing this button will generate a preview of the export data. This is a good way to check everything is to your liking.
Browse: This allows you to browse your library to find where you want to export your data to.

