Sift - Explore Page: Difference between revisions
| Line 57: | Line 57: | ||
<ul> | <ul> | ||
<li><strong>X-Axis Edit...</strong>:Pulls up a dialog used for editing the plot's X Axis Title, auto scale, and max | <li><strong>X-Axis Edit...</strong>:Pulls up a dialog used for editing the plot's X Axis Title, auto scale, and max/min, as described [[Sift - Plot Options Dialog#X Axis Options|Here]] in the X Axis options.</li> | ||
<li><strong>Y-Axis Edit...</strong>:Pulls up a dialog used for editing the plot's Y Axis Title, auto scale, and max/min, as described [[Sift - Plot Options Dialog#Y Axis Options|Here]] in the Y Axis options.</li> | |||
<li><strong>Font</strong>: Pulls up the Font Select Dialog as described [[Sift - Select Font Dialog|here]].</li> | |||
</ul> | </ul> | ||
Revision as of 18:39, 18 March 2024
Sift's explore page provides an easy way for users to plot and view their data, whether the intention is to export graphs or validate the the data.
General
 Query Builder...: Opens the Query Builder Dialog
- Register Curves...: Opens the Curve Registration Dialog
- Refresh Plot: Refreshes the active plot with any newly selected data and styles.
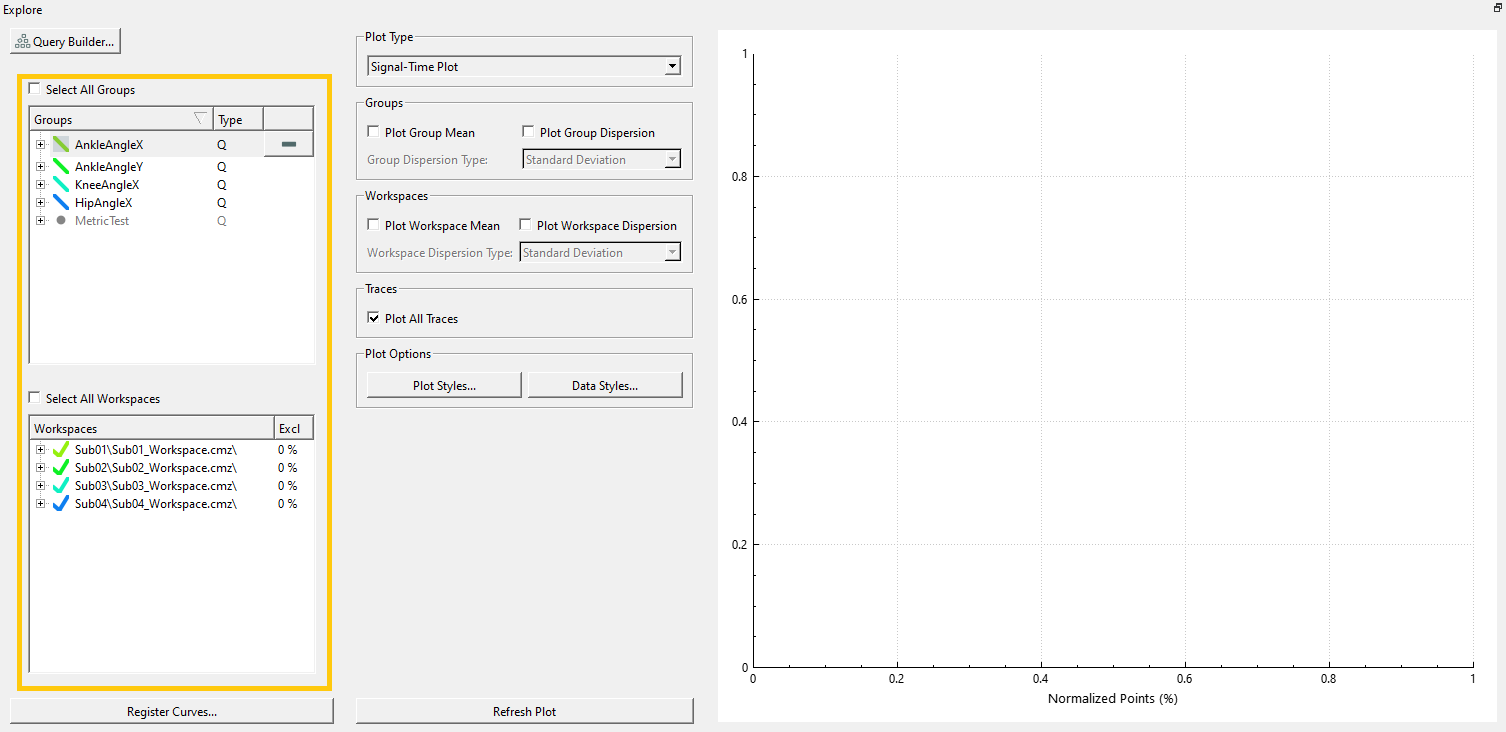
Group and Workspace Widget
The group and workspace widget displays all grouped queries and their associated workspaces, this is used to select the query groups to be displayed in the plot section.
A detailed map of the Group and Workspace Widget can be found here.
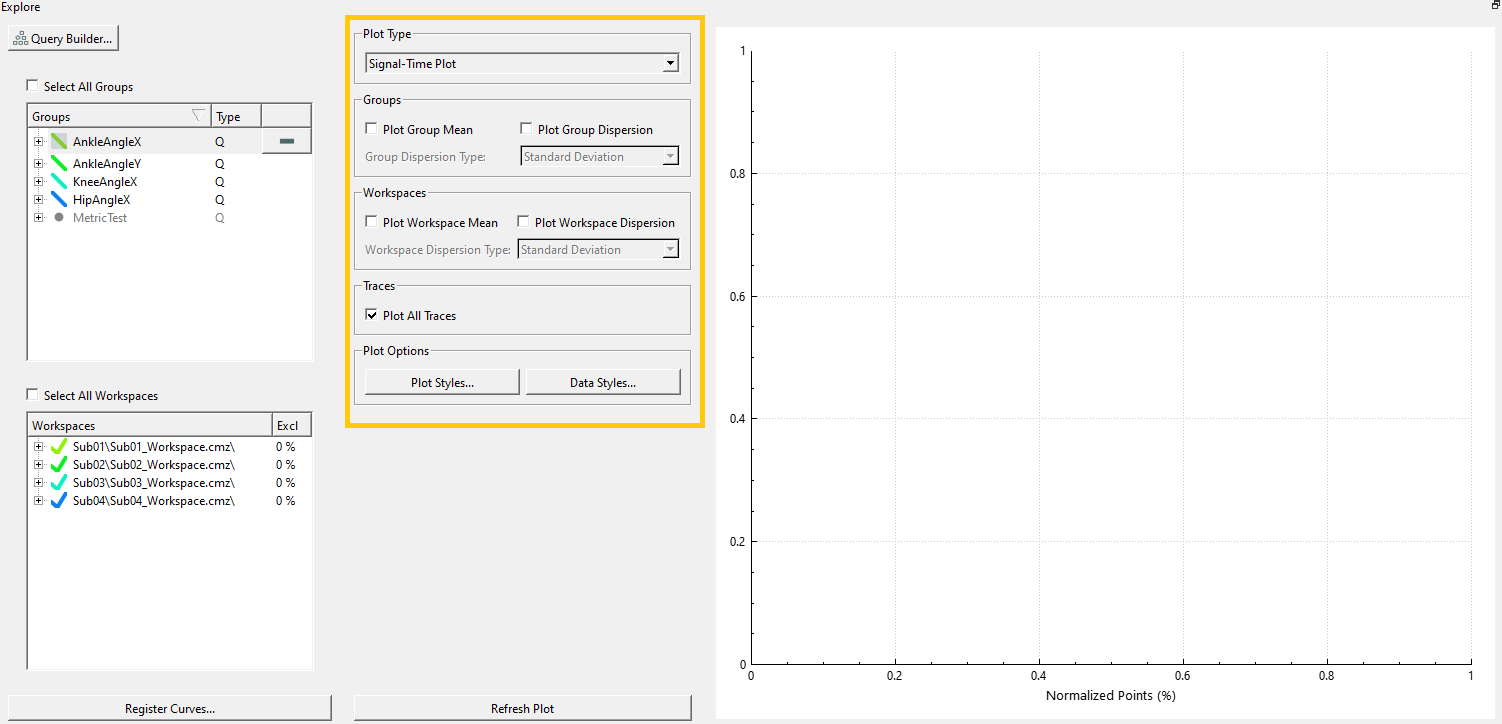
Plot Controls
The plot controls offer plotting options for any graphs displayed, some of these options differ depending on the type of plot selected.
A detailed map of the different plot types and their control features can be found here
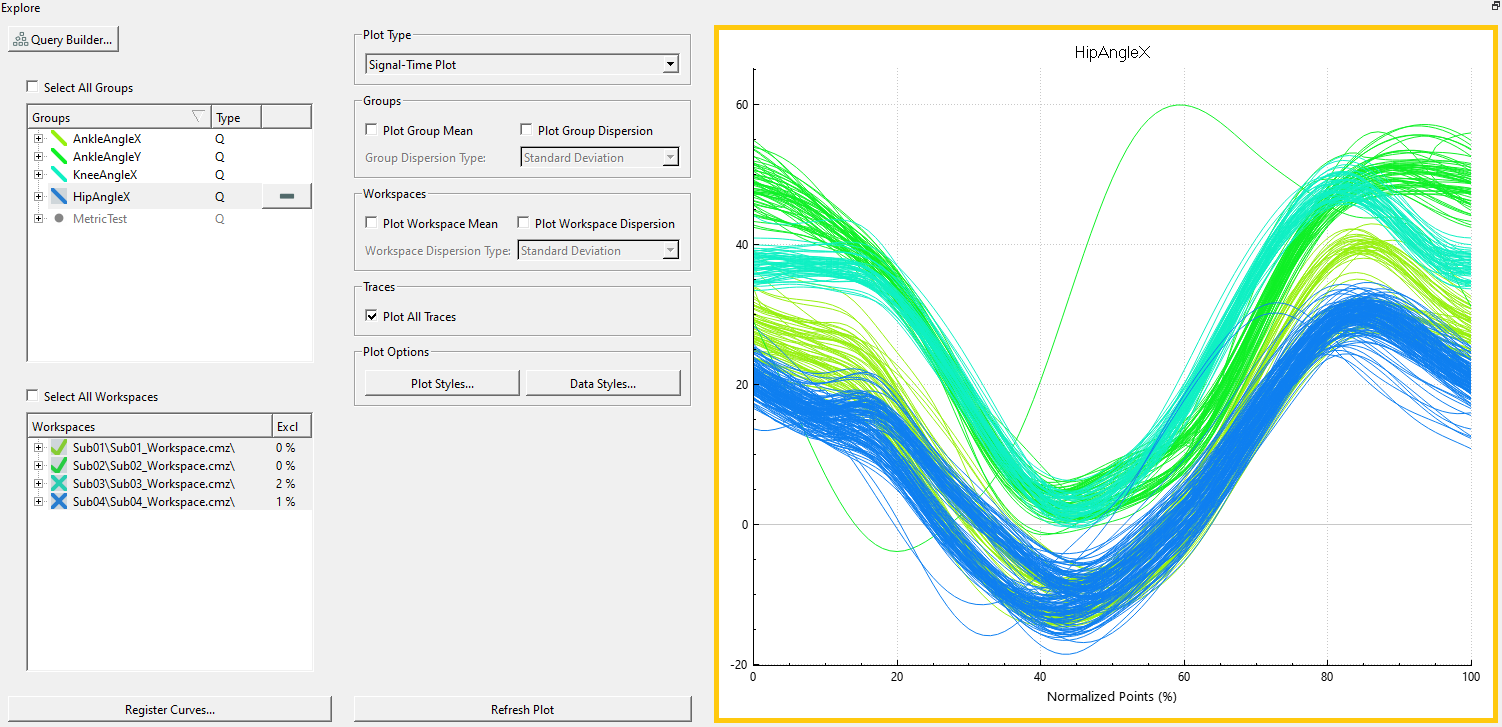
Plot Viewer
 The plot viewer displays all generated plots, allowing to switch between multiple plots and interact with them.
General Plot Interactions
- Zoom: Scrolling up or down on the mouse wheel will zoom in or out on the plot the cursor is over (zoom can be reset through the context menu or the
 Rescale Graph button on the toolbar).
 - Isolating Trace: Left clicking on a trace will isolate it, increasing the transparency of all other traces, several interactions can be done with a selected trace through the context menu or the
 Exclusion Options button on the toolbar.
Context Menu

Right clicking on a plot will pull up the context menu
- Exclude
- Exclude Trace (raw data): Excludes the selected trace
- Show Excluded Data: Displays any data that has been excluded
- Hide Excluded Data: Hide any data that has been excluded
- Axis
- X-Axis Edit...:Pulls up a dialog used for editing the plot's X Axis Title, auto scale, and max/min, as described Here in the X Axis options.
- Y-Axis Edit...:Pulls up a dialog used for editing the plot's Y Axis Title, auto scale, and max/min, as described Here in the Y Axis options.
- Font: Pulls up the Font Select Dialog as described here.

