Sift - Explore Page: Plot Controls: Difference between revisions
Jump to navigation
Jump to search
No edit summary |
No edit summary |
||
| Line 60: | Line 60: | ||
==Metric== | ==Metric== | ||
[[file:sift_metric_plot_controls.png]] | [[file:sift_metric_plot_controls.png]] | ||
<br> | |||
<ul> | |||
<li><strong>Plot Type</strong>: A drop down to select a different plot type.</li> | |||
<li><strong>Groups</strong> | |||
<ul> | |||
<li><strong>Plot Group Mean</strong>: Checking this will plot the mean value of the query group.</li> | |||
<li><strong>Plot Group Dispersion</strong>: Checking this will display the dispersion of the query group.</li> | |||
<li><strong>Group Dispersion Type</strong>: A drop down to select the type of dispersion to display, options include: Standard Deviation, Two Standard Deviations, and Interquartile Range.</li> | |||
</ul> | |||
</li> | |||
<li><strong>Workspace</strong> | |||
<ul> | |||
<li><strong>Plot Workspace Mean</strong>: Checking this will display the mean value of the selected workspaces.</li> | |||
<li><strong>Plot Workspace Dispersion</strong>: Checking this will display the dispersion of the selected workspaces</li> | |||
<li><strong>Workspace Dispersion Type</strong>: A drop down to select the type of dispersion to display, options include: Standard Deviation, Two Standard Deviations, and Interquartile Range.</li> | |||
</ul> | |||
</li> | |||
<li><strong>Plot All Traces</strong>: If this is checked all individual traces will be plotted.</li> | |||
<li><strong>Plot Options</strong> | |||
<ul> | |||
<li><strong>Plot Styles...</strong>: Pulls up the plot options dialog as described [[Sift - Plot Options Dialog|here]]</li> | |||
<li><strong>Data Styles...</strong>: Pulls up the data options dialog as described [[Sift - Data Options Dialog|here]]</li> | |||
</ul> | |||
</li> | |||
</ul> | |||
==Signal Signal== | |||
[[file:sift_signal_signal_plot_controls.png]] | |||
<br> | <br> | ||
<ul> | <ul> | ||
Revision as of 20:06, 18 March 2024
The Explore Page's plot controls sets the type and style of data displayed in the plot viewer, there are four different types of plots:
- Signal Time: Plots a continuous value over the course of time.
- Metric: Plots a discrete calculated value.
- Signal Signal: Compares a pair of continuous values.
- Metric Metric: Compares a pair of discrete values.
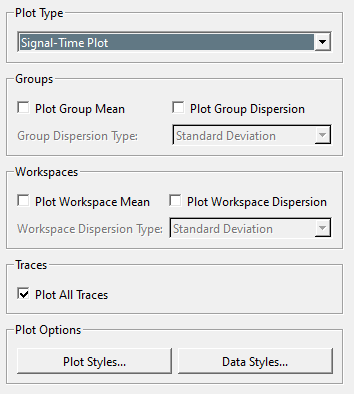
Signal Time
- Plot Type: A drop down to select a different plot type.
- Groups
- Plot Group Mean: Checking this will plot the mean value of the query group.
- Plot Group Dispersion: Checking this will display the dispersion of the query group.
- Group Dispersion Type: A drop down to select the type of dispersion to display, options include: Standard Deviation, Two Standard Deviations, and Interquartile Range.
- Workspace
- Plot Workspace Mean: Checking this will display the mean value of the selected workspaces.
- Plot Workspace Dispersion: Checking this will display the dispersion of the selected workspaces
- Workspace Dispersion Type: A drop down to select the type of dispersion to display, options include: Standard Deviation, Two Standard Deviations, and Interquartile Range.
- Plot All Traces: If this is checked all individual traces will be plotted.
- Plot Options
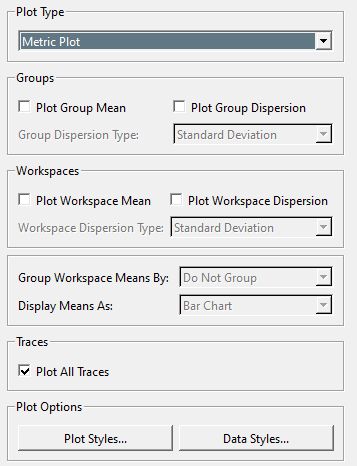
Metric
- Plot Type: A drop down to select a different plot type.
- Groups
- Plot Group Mean: Checking this will plot the mean value of the query group.
- Plot Group Dispersion: Checking this will display the dispersion of the query group.
- Group Dispersion Type: A drop down to select the type of dispersion to display, options include: Standard Deviation, Two Standard Deviations, and Interquartile Range.
- Workspace
- Plot Workspace Mean: Checking this will display the mean value of the selected workspaces.
- Plot Workspace Dispersion: Checking this will display the dispersion of the selected workspaces
- Workspace Dispersion Type: A drop down to select the type of dispersion to display, options include: Standard Deviation, Two Standard Deviations, and Interquartile Range.
- Plot All Traces: If this is checked all individual traces will be plotted.
- Plot Options
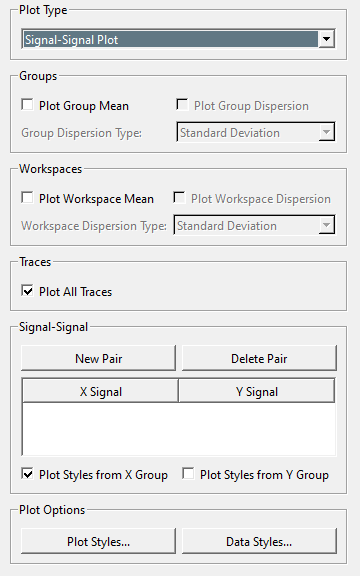
Signal Signal
- Plot Type: A drop down to select a different plot type.
- Groups
- Plot Group Mean: Checking this will plot the mean value of the query group.
- Plot Group Dispersion: Checking this will display the dispersion of the query group.
- Group Dispersion Type: A drop down to select the type of dispersion to display, options include: Standard Deviation, Two Standard Deviations, and Interquartile Range.
- Workspace
- Plot Workspace Mean: Checking this will display the mean value of the selected workspaces.
- Plot Workspace Dispersion: Checking this will display the dispersion of the selected workspaces
- Workspace Dispersion Type: A drop down to select the type of dispersion to display, options include: Standard Deviation, Two Standard Deviations, and Interquartile Range.
- Plot All Traces: If this is checked all individual traces will be plotted.
- Plot Options


