Sift - Curve Registration: Difference between revisions
| Line 49: | Line 49: | ||
Curve registration results can be exported as an image, or as text file containing all data points. To export an image of the plot, right click on it to show the context menu. In the context menu select Export. A dialog will appear allowing you to choose which type of image you want it exported as, and what size. | Curve registration results can be exported as an image, or as text file containing all data points. To export an image of the plot, right click on it to show the context menu. In the context menu select Export. A dialog will appear allowing you to choose which type of image you want it exported as, and what size. | ||
To export the data go to the [[File:sift_export_results.png|30px]] <b>Export Results</b> tab on the tool bar to | To export the data go to the [[File:sift_export_results.png|30px]] <b>Export Results</b> tab on the tool bar to prompt the [[Sift - Export Results Dialog| Export Results Dialog]]. Change the Export Type to Registered Curves and export the results. You can either export the registered traces, the warping functions, the landmark mean locations, and the original landmarks for all traces. | ||
[[Category:Sift]] | [[Category:Sift]] | ||
Revision as of 15:32, 26 March 2024
| Language: | English • français • italiano • português • español |
|---|
Curve registration has been proven to aid in analysis of biomechanical signals, and can produce more accurate results in time continuous analysis including PCA, due to sensitivity towards time varying events. When looking at a signal in a dataset, we typically see variation in the amplitude and phase. When physical time may not impact or be relevant to real life systems, there is sometimes a need to align the curves on a system time rather than a clock time to correct phase variation. This is done by registering the curves to a specific landmark. In the world of biomechanics and gait analysis, we can register curves by certain events, such as the max or min of a signal to see a better representation of amplitude variation.
Mathematics of Curve Registration
Curves are registered by applying a time warping function, h(t), on the original curve, x(t).
x* (t) = x [h(t)]
The time warping function is unique to each curve and transforms the physical (typically clock) time to the system time. This require a landmark for the whole system to be registered, by taking the mean location of a landmark across all curves. The time warping function then adjusts each individual curve so that the curve specific landmark happens at the same time through linear interpolation. The time warping ensures that the following equation is always satisfied.
h-1 [h(t)] = t
Registering Curves in Sift
Located in the Explore Page, curve registration allows you to easily register your curves, and view them just like any other group. You are able to register and signals by maximums, minimums, local maximums, local minimums and defined intermediate events, allowing for flexibility depending on your needs.
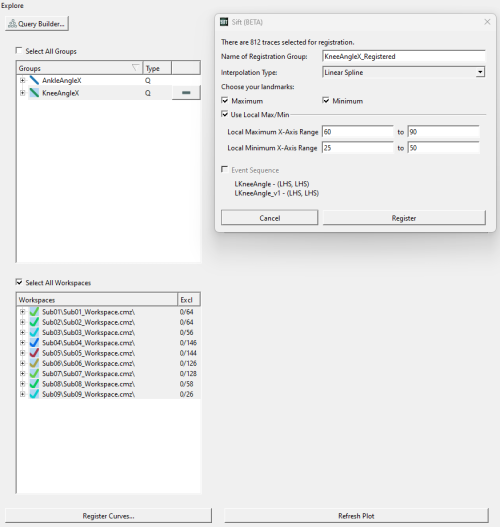
To register a curve, in the Explore Page select a group, and the workspaces wanted, and select the Register button. This will prompt a dialog to come up allowing you to chose how you want to register the curve.
Example 1: registering to local max/min

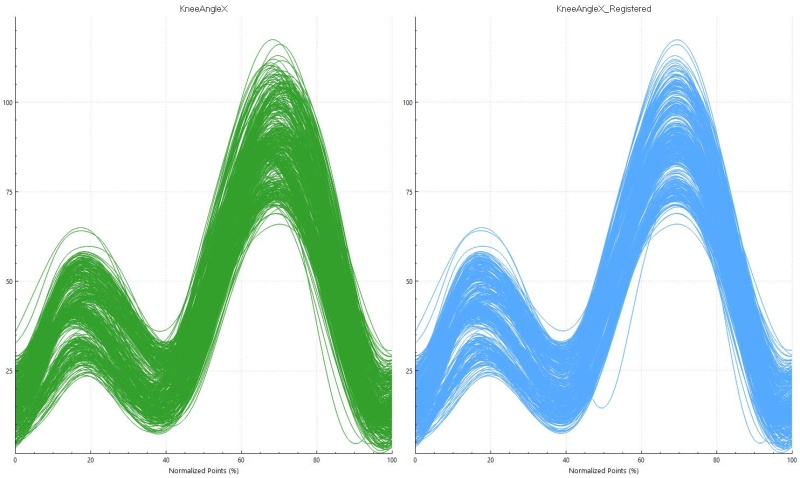
In this example we selected the KneeAngleX query to be registered.
We will register the curves to a local maximum between 60 and 90, and a local minimum between 25 and 50.
Here we can see the difference between the original curves (left), and the registered curves (right).
Example 2: registering to intermediate event
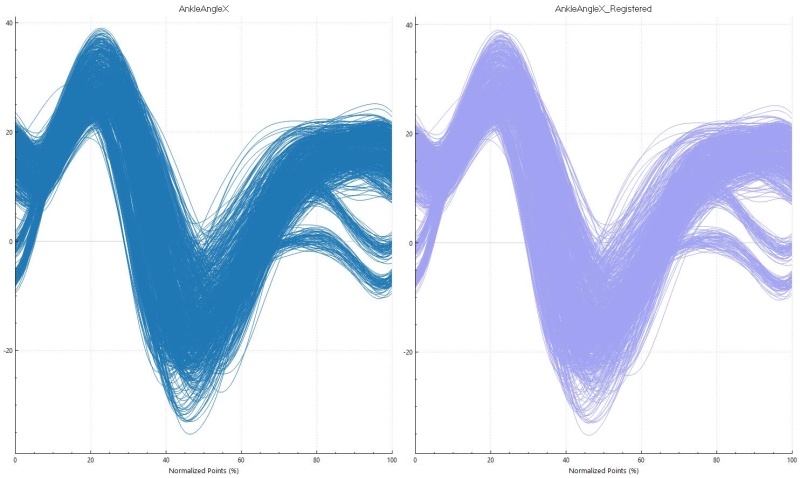
In this example we selected the AnkleAngleX query to be registered.
We will register the curves to its event sequence LHS, RHS, LHS. Note: Event sequences must be defined in the query builder, and must have more than two events to be registered.
Here we can see the difference between the original curves (left), and the registered curves (right).
Exporting Results
Curve registration results can be exported as an image, or as text file containing all data points. To export an image of the plot, right click on it to show the context menu. In the context menu select Export. A dialog will appear allowing you to choose which type of image you want it exported as, and what size.
To export the data go to the ![]() Export Results tab on the tool bar to prompt the Export Results Dialog. Change the Export Type to Registered Curves and export the results. You can either export the registered traces, the warping functions, the landmark mean locations, and the original landmarks for all traces.
Export Results tab on the tool bar to prompt the Export Results Dialog. Change the Export Type to Registered Curves and export the results. You can either export the registered traces, the warping functions, the landmark mean locations, and the original landmarks for all traces.

