Inspect3D Tutorial: Load and View Data

From Software Product Documentation
Jump to navigation Jump to search
Language:  English  • français • italiano • português • español 

This tutorial begins by assuming that you have a CMZ file for each subject/session from Visual3D. If necessary you can use our build CMZ feature or work through the Visual3D tutorial for building a CMZ file.

Data

This tutorial can be completed with any CMZ file. One possibility is a data set from a Visual3D Workshop at a recent ASB meeting: V3D Workshop @ ASB.

Load your library

To start, you need to tell Inspect3D where to look for your data. After opening Inspect3D:
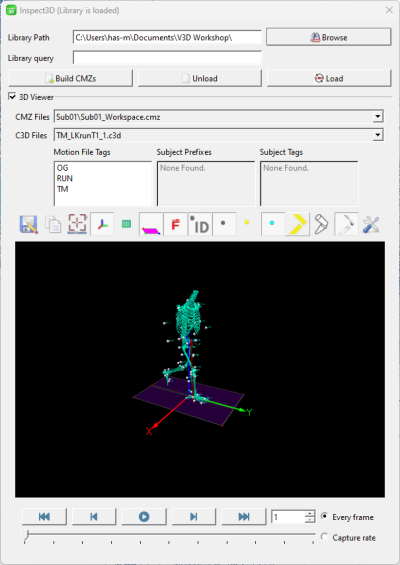
  1. Click the Load Library button on the toolbar to open the Library dialog:
    1. Click Browse to open a dialog that allows you to select a file path
    2. Select the top level folder/root directory which contains the CMZ files NOTE: the CMZ files' associated CMX files must also be present for Inspect3D to be able to load the library.
    3. Click Select Folder
  2. Click Load
  3. Once the library is loaded, you will be able to do some initial exploration here in the Load Library dialog:
    1. Verify which CMZ files have been loaded in the 3D Viewer dropdown box as well as which C3D files are associated with each CMZ;
    2. Verify which file tags are present in the library;
    3. If you have loaded multisubject data, verify which subject prefixes and subject tags are present in the library; and
    4. Animate the data contained in any loaded C3D file.
  4. Close the Library dialog

Define queries and group signals

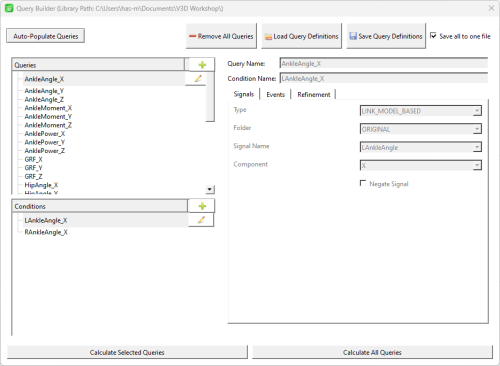
Once you have loaded the library, the Group definition dialog will be activated. You now have the ability to automatically or manually define queries that will group the signals in your library. To do this:

  1. Click on the Query Definitions icon on the toolbar
  2. Click on Query Definitions to define group definitions for the first time and open the Query Builder Dialog
  3. Alternatively, if you have previously saved query definitions, you can click on Load Query Def & Compute Groups to load a .q3d file containing query definitions and then automatically calculate the groups for the loaded library.
  4. Once the Query Builder dialog is open there are two options for creating group definitions:
  5. Either manually create group definitions by
    1. Clicking the green addition button to name a new group and add it
    2. While your new group is selected, click the green addition button to name and define a new sub-group
    3. Repeat these steps until you have created all of your groups
  6. OR Click Auto-Populate Groups
    1. Accept the default settings and click Create

    Once you have created your query definitions:

  7. Click Calculate All Queries to apply the queries you have defined to the loaded library.
  8. Close the Query Builder dialog. Note that if Inspect3D has not finished computing all of the groups then it will ask you if you want it to continue. Click Compute Groups.
Manually Create Group Definitions (Video)

Visualize your data

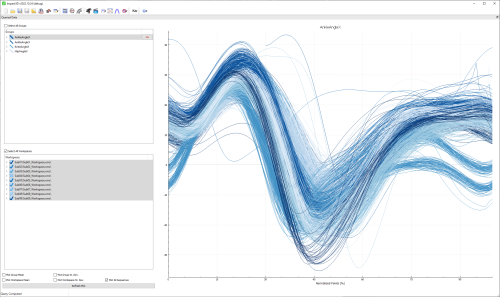
"An example of many time-normalized traces plotted for the AnkleAngleX signal."

Now that the signals in the library have been grouped, it is now possible to visually examine them and begin exploring your data:

  1. Select a particular group in the Groups widget of the Queried Data subwindow to determine which signals you would like to view
  2. Selecting different workspaces in the Queried Data subwindow's Workspaces widget determines which are displayed. Checking the Select All Workspaces box conveniently displays all of the workspaces associated with your selected group(s)
  3. Check the appropriate boxes to plot all sequences, workspace means/standard deviations, and group means/standard deviations.
  4. Click Refresh Plot

The Options dialog allows you to modify the plot options to determine what is displayed. For example, you can choose the number and layout of plots to display, change how lines are coloured and styled, and modify axis labels among many other things.

If you have multiple plots, then a gray bounding box will appear around the active plot, identifying which plot is currently being modified.

Interact with your data

You can highlight a trace by left-clicking on it. This causes the trace to become more visually prominent than non-highlighted traces and produces a tooltip that includes:

  1. The trace's group name
  2. The trace's workspace name
  3. The name of the specific C3D file for that trace
  4. The trace's frame range from that C3D file
  5. The trace's sub-group name
  6. The x- and y- values of the trace where you left-clicked it

A trace can be excluded from the plot by:

  1. left-clicking on the trace to highlight it; then
  2. right-clicking and selecting Exclude > Exclude Trace (raw data) from the context menu.

You can confirm that the trace has been excluded in the Workspaces widget: excluded traces will be marked with a red X and workspaces containing excluded traces will have their checkmark icon replaced by an X.

Manually View Group Definitions (Video)

Save the application workspace

Click Save Workspace As to save the work you've done so far. This saves the application workspace as an .i3d file, which is an XML file.

NOTE: If you have excluded data then your CMZ files are out of sync with your Inspect3D workspace at this point. This means that if you re-queried the loaded library, you would need to exclude the traces again. To avoid this, click the Update CMZ files icon on the toolbar to update your CMZ files at any point.
Navigate Tutorials

Previous: None
Inspect3D Getting Started Tutorials
Next: Tutorial 2: Clean your Data
Retrieved from ""