Tutorial: Creating a Report
| Language: | English • français • italiano • português • español |
|---|
Objectives
The objective of this tutorial is to provide an overview of reporting in Visual3D.
Visual3D creates a Workspace into which all data is stored, models are integrated, and reports are produced. The entire workspace can be saved and shared as a digital report in which all the underlying analysis, data, and models can be accessed.
Every Visual3D workspace includes exactly one report, which is initially blank, and to which you may add any number of distinct pages. In a sense, the entire workspace is itself a kind of extended electronic report, which contains not only the contents of the Reporting page but also all of the original data and records of all data-processing steps.
Visual3D reports are laid out according to a row/column structure. Each report page can have a distinct number of rows and columns, and you can specify that certain items span multiple rows or columns. Items which can be included in reports include graphs, tables, graphical representations of metrics (e.g. gait analysis metrics such as step length and cycle time), subject and laboratory information, and bitmap images imported from other programs.
Creating a Report Template
After you have created a report, you may choose to save a report template file, which saves not only the formal structure of the printed report, but actually the entire structure of the workspace, i.e., everything but the data. Provided you are consistent in naming your standing and movement trials, markers, etc., you can re-use such templates for many experiments of the same type (e.g., same experimental protocol, multiple subjects).
Opening a Report Template
To open a report template, select the File menu option "Open Report Template"
This tutorial will create a simple report template, which can be created through the following tutorial, or a sample report template can be found here.
Create Report Tutorial
This tutorial will walk you through the steps to creating a simple report.
Page 1 of this report will display temporal distance measures using Visual3D's built in calculations.
Page 2 of this report will display a simple 2D graph of sagittal knee kinematics.
For more information about all report options offered by Visual3D (e.g. images, text/metric tables, subject information), please view the Visual3D_Reports Wiki page.
Prepare for the Tutorial
To prepare for the tutorial:
- Open the file CreatingReport_Tutorial_blank.zip.
- This file contains:
- Pre-defined joint angles. For more information about defining joint angles, please see the tutorial on creating Compute_Model_Based_Data
- Gait Event Labels (e.g. heel strikes and toe offs). LHS/LTO events indicate kinematic events (no force data available for that gait cycle), and LON/LOFF indicate kinetic events (force data). Events were created using the Automatic_Gait_Events pipeline command.
- Tag name "Walk", for more information about creating tag names please see TAGS
- Click on the Signal and Event Processing Tab to visualize the animation of the model based on the movement data and the model that was applied to it. If the animation doesn’t appear in the 3D Animation viewer, check the active file combo box on the toolbar. It should read NWalk0001.c3d rather than ALL-FILES.
- This file contains:
Creating a Report
To start creating a report, switch to Reporting Mode by clicking on the Report mode tab. The report elements are blank. 
Report Temporal Distance Metrics
- To add a report page for temporal and distance metrics
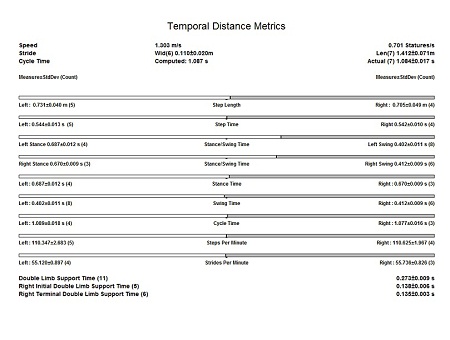
- 1. Select Item to Add -> Temporal and Distance Metrics and click on the Add button.

- 2. Enter the Gait Event Labels. Selecting strict sequencing means that the events must occur in a specified gait order; e.g.
- Right Heel Strike
- Left Toe Off
- Left Heel Strike
- Right Toe Off
- NOTE: If a subject is walking on a treadmill, the treadmill speed (positive) must be entered in this window. The direction of the treadmill should indicate which direction the subject would have been progressing in the lab if there were no treadmill. To indicate positive Y direction, enter VECTOR(0,1,0)
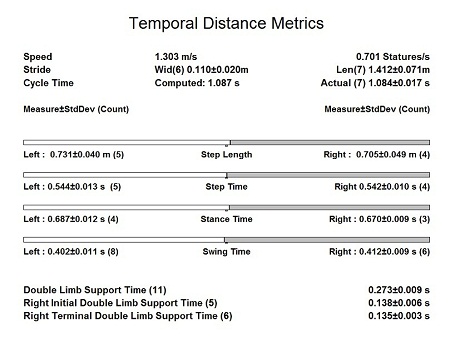
- 3. The following chart will appear on page 1 of the report.


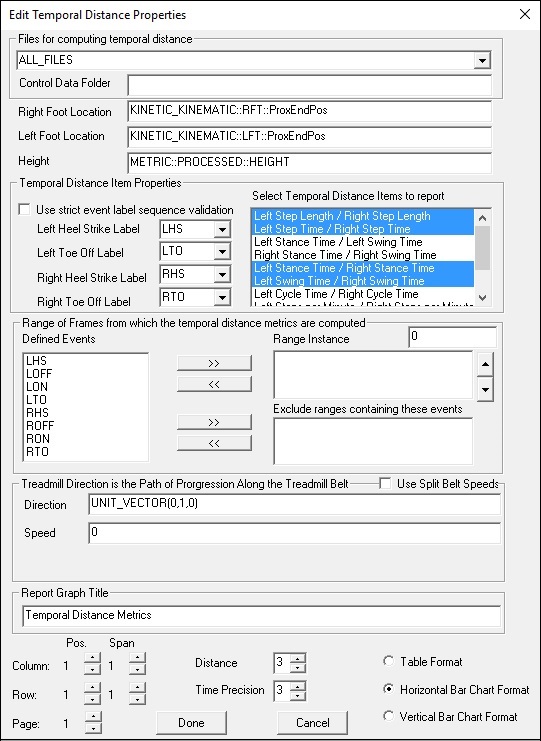
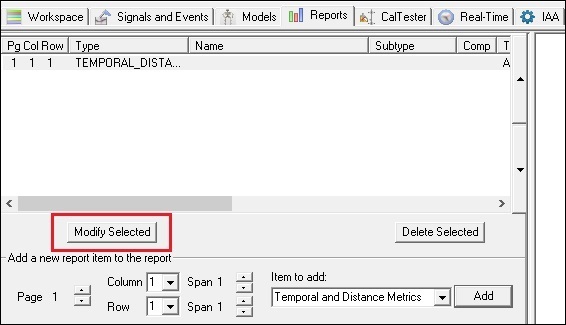
- To edit the temporal distance page of a report
- 1. Open the Temporal and Distance Metrics Window by selecting temporal distance and clicking Modify Selected
- 2. Select the desired metrics and click Done
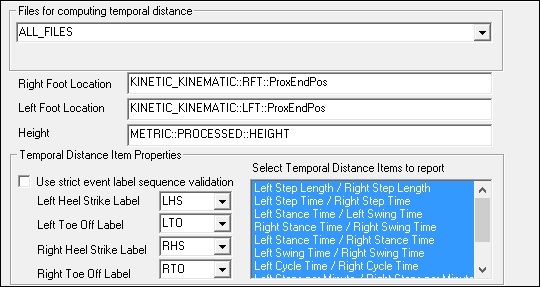


- 3. The new temporal distance measures will appear in the report

Report 2D Graph
4.4 Create another page by:
- 1. Clicking on the Insert Page After button
- 2. Select 2D Graph from the drop down menu
- 3. Press Add, and the "Add/Modify Graph" Window will appear
- 1. Clicking on the Insert Page After button

Draw 2D Graph
This section will create a 2D graph of sagittal knee kinematics being graphed as a percent of the gait cycle (from left heel strike to left heel strike). A vertical purple line will be graphed to represent left toe off.
Once open, notice that the Add/Modify Graph dialog window is separated into four sections, Graph Title, Graph Properties, X Axis Properties, and Y Axis Properties.

In the Add/Modify Graph Window:
- Graph Title Options:
- Enter Sagittal Knee Kinematics as the Graph Title
- In Visual3Dv5 it is possible to change the font size and color of the Graph Title, but it is not possible in earlier versions
- Graph Properties:
- Location:
- Column, Row, & Span should be set to 1
- Page should be set to 2
- NOTE: The report pages are separated into 5 rows and 5 columns, numbered 1 though 5, left-to-right, top-to-bottom. The span option defines the number of rows and column will the graph cover.
- Files to Graph: Select Walk
- NOTE: This box defines which file or file groups (see Tag for more detail) to be graphed. By default, ALL_FILES will be graphed.
- Set Line Color to Green
- Set Line Style to Solid
- Select Graph Mean
- Select Graph Standard Deviation
- Annotations:
- NOTE: The annotations option allows you to view annotations on the graph based on events specified in your dynamic trials. Annotations will be added to this graph after the other properties have been defined.
- Location:
- X Axis Properties:
- X Axis Label: Normalized (% gait cycle)
- Data Type: FRAME_NUMBERS
- Data Name : FRAMES
- Select: Normalize 0% to 100%
- Graph within a range of events:
- Range Begin: LHS
- Range End: LHS
- Y Axis Properties:
- Y Axis Label: Extension / Flexion (degrees)
- Data Type: Link_Model_Based and name = Left_Knee_Angle
- Component : FRAMES
- Folder: ORIGINAL
Draw 2D Graph: Annotations
- To add an annotation:
- Click Annotations...
- Annotations Editor dialog box will open, click Add
- In the Annotations dialog box:
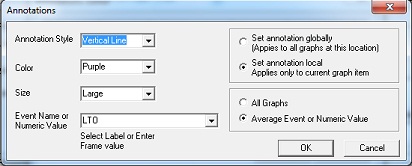
- Annotation Style: Vertical Line
- Color: Purple
- Size: Large
- Event Name or Numeric Value: LTO
- Select Set annotation local - Applies to current graph item
- Select Average Event or Numeric Value
- Select OK
- The annotation should now appear in the Annotations Editor dialog box:
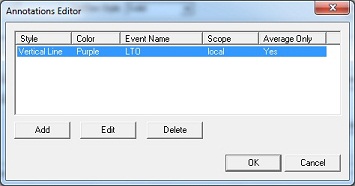


Select OK in the Annotations Editor dialog box
Select Done in the Add/Modify Graph dialog
The following graph should appear:

Format 2D Graph

- Select the graph by left clicking on the desired graph, a box will appear around the desire graph
- Right click on the graph and select Format Graph...
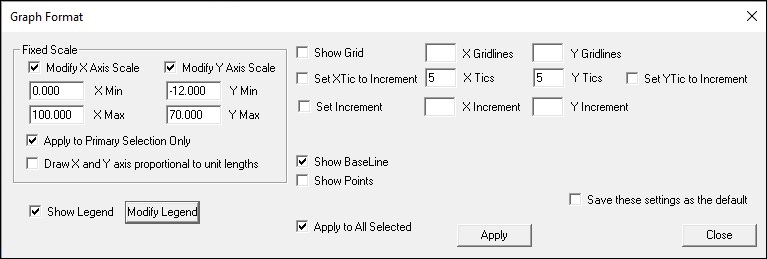
- Check the box next to Modify Y Axis Scale:
- Set Y Min: -12
- Set Y Max: 70
- Check the box next to Show Legend
- Select Modify Legend
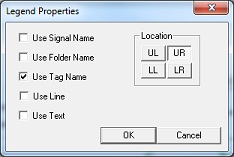
- In the Legend Properties dialog box:
- Check Use Tag Name
- Set Location to UR
- Select OK
- In the Legend Properties dialog box:
- Select Apply on the Graph Format dialog box
- Check the box next to Modify Y Axis Scale:


The 2D graph should now display the tag name, "Walk", on the upper right hand corner, and the minimum/maximum values of the y-axis should be set from -12 to 70 degrees:

Add Balloon Text
To add custom text to the current page:
- This option is only available in Version5 - to add text annotations in earlier version, the Make_Text_Annotation pipeline command must be used.
- NOTE: Balloon text is specific to the page, not the current graph.

Add Balloon Text by:
- Selecting Balloon Text from the drop down menu
- Press Add, and the "Edit Balloon Text Item" dialog box will appear

- Set position of balloon text:
- Page should be set to 2
- Set Position across (0-100%) to 22
- Set Position down (0-100%) to 77
- Uncheck Draw box around text
- Set Balloon Text Identifier to LHS1
- Enter the text to be displayed: LHS
- Select OK
Create a second balloon text image by following the steps above and enter the following in the "Edit Balloon Text Item" dialog box:
- Set position of balloon text:
- Page should be set to 2
- Set Position across (0-100%) to 89
- Set Position down (0-100%) to 77
- Uncheck Draw box around text
- Set Balloon Text Identifier to LHS2
- Enter the text to be displayed: LHS
- Select OK
The text "LHS" should now appear at 0 and 100% of x-axis:

Draw horizontal bars on a Report Graph
|
You can draw horizontal bars to indicate ON/OFF signals. Instructions to do this can be found here. |
|

Using Search/Replace to create multiple pages
When creating reports with multiple pages using the same format, but graphing differently tagged items or using different events, it is possible to use the Search/Replace function to quickly create new pages.
- First create a copy of the page using the Duplicate Page button.
- Then go to the new duplicated page, and click the Search/Replace button to open the options.
- From within this dialog box, select the old file tag or old event label, and the event or tag to replace it with, then click add.
- This will automatically replace the old event or tag and replace it with the new one.
Save Report Template
Report templates may be saved so that they can be applied to other CMO files.
To save a report template, you can go to File -> Save Report Template. Or use the icon on the toolbar:
|
In the Report Tab, an icon will appear to save the report template (see right). |
|

NOTE: As of Visual3Dv5, an error in the save report template was introduced. Although we are working to fix this error, it occurs intermittently, so it is difficult to track down the issue. If an error comes up when trying to save the report template, save the CMO file you are currently working on, clear the workspace (File -> New), and re-open the CMO file. You will now be able to save the report template successfully.
On-Screen Report Presentation
Once the report is finalized, click the Edit Report button to exit the report editing function and display the 3D animation viewer instead.

Plotting Normal Data:
Normal data can be added to a report (gray band).
For instructions to plot normal data, please view the Plotting Normal Data Tutorial.
Before plotting normal data, an average data file must be created from the CMO Library. Instructions to create an average data file can be found here.

Scripting Report Templates
Report templates may also be created using the Make_Line_Graph pipeline command. In conjunction with the Make_Line_Graph command, For_Each loops can be used to create a report template in a few steps. Before creating a Report Template from a script, it is important to understand that the
RECALC pipeline (which saves the COMPUTE_MODEL_BASED_DATA commands) is also saved in the .rgt file (the report template file).
An example of how to create a simple report template using a pipeline script can be found here.
NOTE: Using this method requires a prior knowledge of writing pipeline scripts, and it is suggested to complete the pipeline tutorials prior to testing this method.