EMG: Difference between revisions
| Line 129: | Line 129: | ||
*[[Tutorial_EMG|Example Processing EMG Signals]] | *[[Tutorial_EMG|Example Processing EMG Signals]] | ||
*[[Pipeline_Processing_Example_4|Example Assigning Tags to Files based on Filenames]] | *[[Pipeline_Processing_Example_4|Example Assigning Tags to Files based on Filenames]] | ||
[[Category:EMG]] | [[Category:EMG]] | ||
Revision as of 19:11, 11 May 2023
| Language: | English • français • italiano • português • español |
|---|
Overview
Electromyography (EMG) signals are electrical signals generated by the activity of skeletal muscles that are responding to inputs from the central nervous system. When a muscle contracts, it generates electrical activity that can be measured using electrodes. The electrodes can be placed on the surface of the skin or they can be intramuscular (inserted under the skin with a narrow needle). EMG data is collected as a voltage difference between a recording site and a reference site. Typically the recording site will be the fleshy part of a muscle and the reference site would be near a bony part of the body. EMG signals are used as diagnostics tools for identifying neuromuscular disorders or in research for studying muscle activation, motor control and muscle fatigue. They can also be used as control signals for prosthetic devices.
Sources of Noise in EMG Data
One of the challenges with collecting EMG data is that because the signals are very small (typically around 0-10 mV), and the electrodes used to measure them are prone to picking up other signals that can obscure the data we interested in collecting.
Sources of noise in EMG signals include:
- Physiological features: fat, blood flow velocity, skin temperature and different measuring sites can introduce noise into EMG signals.
- Inherent noise in electrodes: electrical equipment generates electrical noise, which can be picked up in EMG measurements.
- Motion artifacts: the motion of cables during EMG measurements can produce noise in EMG data.
- Cross talk: depending on the placement of electrodes relative to the location of the muscle that is being studied, sometimes an EMG can pick up signals from a muscle that is not the intended target of study.
- Signal instability: EMG signals are quasi random in nature. The number of active motor units, motor firing rate and interaction between muscle fibers can influence an EMG signal.
- Electromagnetic noise: ambient noise from the human body and background radiation can obscure the desired signal to be measured.
What to Look For
The figure below shows what EMG data should look like. There should be a clear burst (red) when the muscle contracts and periods of rest (blue) when the muscle relaxes. Be sure to check your data for clipping, excessive noise, and movement artifacts, as these cannot be corrected after collection.

Sampling Rate and Synchronization
Sampling Rate
Visual3D expects the EMG signals to be stored as ANALOG data, not unlike force platform data. One point of importance is that EMG typically has very high frequency content, which means that it must be sampled at high data sampling rates.
Synchronization
If you plan to analyze your EMG and motion capture data together, the data must be synchronized. Data can be out of sync due to issues such as:
- A physiological issue known as electromechanical delay (EMD)
- Technical issues with data collection (e.g. the saved EMG signal might be "delayed" because the EMG system is wireless)
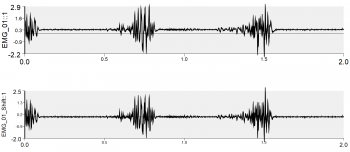
You must know the sync between the analog and motion capture data, but you can use the Shift_Frames command to synchronize the analog data to the motion capture data.
References
2. ISEK EMG Reporting Standards
3. Surface Electromyography For Non-Invasive Assessment of Muscles
5. Surface Electromyography Signal Processing and Classification Techniques
Step 3: Post Processing
There are many different ways, some common methods are:
- Half or full wave rectified
- Linear Envelope (page 269[1])
- Half or Full Wave Rectified
- Lowpass Filter
- Integration of full wave rectified signal over various time periods (page 269[1])
- Root Mean Square (RMS) Amplitude
Step 3a: Remove DC Offset
|
|
Examples:
NOTE: Either method is acceptable to remove the offset.
Step 3b: Process EMG Signal
You should choose one variation of the processing methods below.
Linear Envelope
A linear envelope is simply a half or full wave rectified signal (absolute value) followed by a Lowpass Filter.[1]
A half wave rectified signal signal would only contain the positive component of the EMG signal, a full wave rectified signal is the absolute value of the signal. The examples here will use a full wave rectified signal.
Examples:
Root Mean Square (RMS) Amplitude
- Remove DC Offset prior
- Does not require full-wave rectification[2]
Calculate the RMS of a signal.
Examples:
Integrate
Examples:
Matlab Filter
It's also possible to design a filter in Matlab and implement the filter in Visual3D. This is described here.
Step 3c: Determine when the Muscle is On/Off
Normalize
Examples:
- Normalize EMG to MVC Maximum
- Normalize EMG to Generic Global Variable
- Normalize to Maximum 30 second interval
- Normalize to the Maximum within each Gait Cycle
Onset
Examples:
