Plotting P2D Data
| Language: | English • français • italiano • português • español |
|---|
Introduction
What is P2D Data?
P2D data is average normalized data that was calculated over multiple cycles or trials. Typically, P2D signals are calculated using the Global_Normalized_Signal_Mean command. The average across multiple trials will be stored in the GLOBAL workspace.
Background
To plot control data - or an average data set, you must first create the average data set. This is done by creating a P2D file. Once the P2D file has been created, you can load it into your workspace and add the data to a graph.
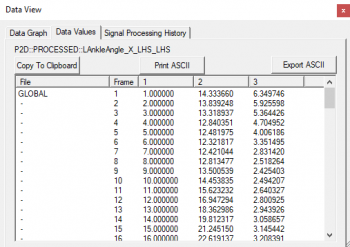
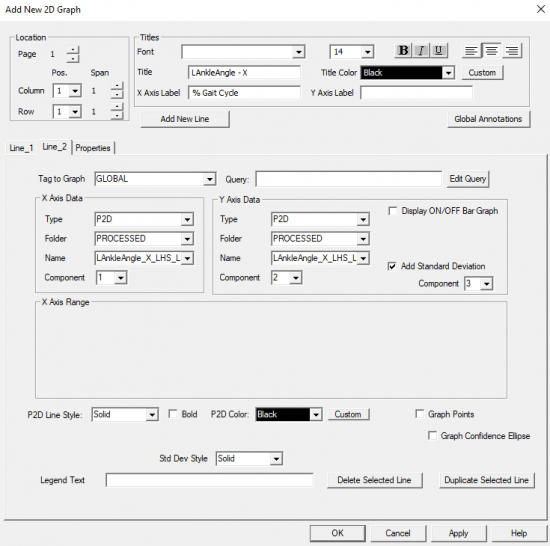
Usually the first element of the P2D file contains the "frame" data (plotted as the X Axis Data), the second component is the mean data (plotted as the Y Axis Data), the standard deviation is the third component (check box "Add Standard Deviation"). The standard deviation will be displayed as a shaded region on the graph.
Download
You can download the sample files here.
- Sub01_Workspace.cmz sample subject workspace
- Normal_Data_Individual_Right_and_Left.vnd sample control database
- Report_Template_P2D.rgt sample report template plotting P2D data
Before you do this tutorial:
Before you complete this tutorial, you want to make sure:
Plot P2D Data
Open the CMZ File
This step is done to load the data for one subject.
- File -> Open
- Select the Sub01_Workspace.cmz file
Load the P2D Data
This loads the P2D file which contains the mean and standard deviation for multiple subjects.
- File -> Open
- Select the Normal_Data_Individual_Right_and_Left.vnd file
Note: The Workspace tab does not display the Normal Database as being open at this time. This is because the normal data is simply stored as signals in the Global Workspace. The Global signals, however, have been loaded and can be seen by selecting GLOBAL as the active file.
Quickly View the P2D Data
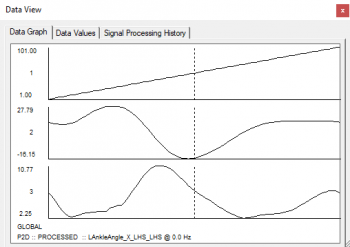
This step is just to familiarize yourself with the P2D file format.
|
In the Signals and Events tab:
|
Plotting the P2D Data
|
In the Reports Tab:
|
|
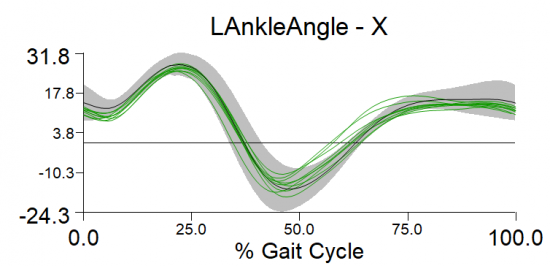
If everything is correct, you should see the data for the data in the CMZ (green lines) and the average data is shown in black. The solid black line is the mean and the gray band is the standard deviation. |
NOTE: If you open the Report_Template_P2D.rgt report template, you will notice that the P2D signals were plotted for the first page.


