Signals and Events
Jump to navigation
Jump to search
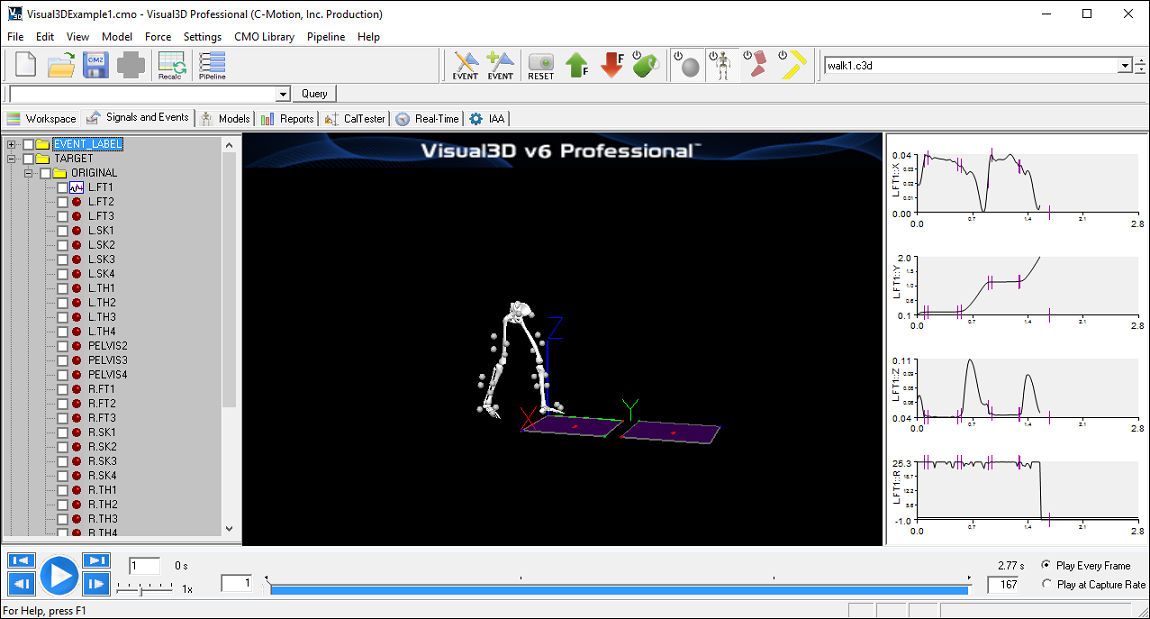
The Signal and Event Processing page is the heart of the data stored in the Visual3D Worksapce. On this page you can examine the data in your workspace in detail, create graphs to visualize signals (time-variant data values), and visualize motion trials as animated graphics. This workspace contains the data tree identifying all signals available from the ACTIVE_FILES, and provides interactive ability to view and modify Event Labels.
The Signal and Event Processing page consists of three main display areas:
- The Data Tree: (here)
- The data tree on the left-hand side of the Signals and Events workspace is a hierarchical view of your data, including raw data imported from the c3d files, and processed data from things such as filtering, gait events, or calculations.
- The Animation Display: (here)
- The animation display in the center of the Signals and Events workspace shows the tracked markers, segments, and forces of the selected c3d file. The animation window can be controlled by playback speed and orientation and can highlight joints or segments of the model (if applied) during the trial. More features of the animation display window can be found (here).
- The Graphs Display: (here)
- The 2D graph display on the right-hand side of the Signals and Events workspace is used to create interactive plots of selected signals (up to 5 separate plots), which can be formatted and customized to show highlight events. More features of the 2D graph display can be found (here).
An example of navigating the data tree, animating trials and creating 2D interactive graphs can be found here: Tutorial: Visualizing Data.
