Sift - Principal Component Analysis: Difference between revisions
No edit summary |
No edit summary |
||
| Line 7: | Line 7: | ||
[[File:SIFT_PCA_Example.png|600px|right]] | [[File:SIFT_PCA_Example.png|600px|right]] | ||
Sift provides a number of ways to visualize and interact with the results of PCA. An overview of all PCA visualizations can be found in [[Sift - Analyse Page#Principal_Component_Analysis| Sift - Analyse Page]]. | Sift provides a number of ways to visualize and interact with the results of PCA. An overview of all PCA visualizations can be found in [[Sift - Analyse Page#Principal_Component_Analysis| Sift - Analyse Page]]. | ||
More detail on the mathematics behind PCA can be found on our page: [[The_Math_of_Principal_Component_Analysis_(PCA)|The Math of Principal Component Analysis (PCA)]]. | |||
This page includes: | This page includes: | ||
Latest revision as of 19:09, 1 May 2024
| Language: | English • français • italiano • português • español |
|---|

Sift provides a number of ways to visualize and interact with the results of PCA. An overview of all PCA visualizations can be found in Sift - Analyse Page. More detail on the mathematics behind PCA can be found on our page: The Math of Principal Component Analysis (PCA).
This page includes:
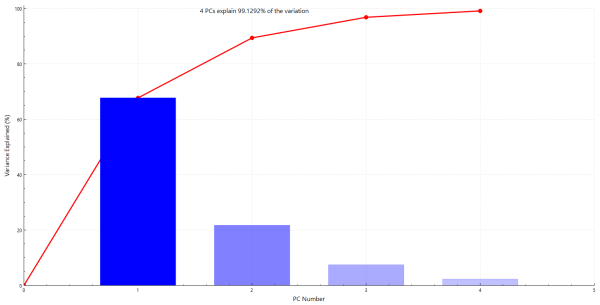
- Visualizing the variance explained by each PC individually;
- Visualizing the variance explained by each PC at each point in the signal's cycle;
- Scatter-plotting workspace scores in PC-space;
- Showing the distribution of scores by group for each PC;
- Visualizing the mean and extreme values that result from reconstructing the underlying data with each PC; and
- Visualizing how the signals can be reconstructed from the computed PCs.
Further Analysis
Sift has several built in modules to take you further with you PCA Analysis, including:
- T-Squared Tests: Finding outliers using a Multi Variate T-Squared Distribution.
- Q-Tests: Finding Outliers on small datasets using a Q-Test.
- Mahalanobis Distances: Finding outliers through their Mahalanobis Distances.
- Local Outlier Factors: Finding outliers through the Local Outlier Factor.
- K-Means Analysis: Clustering PCA results through K-Means clustering.
Tutorials
For a step-by-step example of how to use Sift to perform PCA on your data, see the PCA Tutorial.
For a step-by-step example of how to use Sift to perform further statistical testing on PCA results, see the Tutorial: Run K-Means.
For a step-by-step example of processing and analyzing large data sets in Sift and using PCA to distinguish between groups, see the Tutorial: Treadmill Walking In Healthy Individuals and the Tutorial: Analysis of Baseball Hitters.