CalTester Reports
This page is currently being updated
| Language: | English • français • italiano • português • español |
|---|
Purpose
The CalTester function in Visual3D estimates the optimal position and orientation of a force platform, instrumented treadmill, or instrumented stair within the 3D motion capture volume based on a set of experimental trials using a standard MTD-2 CalTester Rod.
The Mechanical Testing Device (MTD-2) is manufactured and supported by Motion Lab Systems, Inc. The MTD-2 is a precision-machined calibration-testing tool that can be assembled in less than a minute to create a calibration-testing object suitable for a number of 3D biomechanics laboratory tests.
This simple test takes only a few minutes, could be performed prior to any data collection, and provides reassurance that your data collection is sound.

|
CalTester is an essential tool for laboratories that:
- Move cameras and/or Move force platforms regularly
- Have amplifier switches that can be easily bumped
- Have settings that are regularly changed
- Have students or unsupervised visitors in the laboratory
Controls
The CalTester tab automatically uses the file or files that have been loaded into the Visual3D workspace. CalTester can then be controlled using the tool bar at the top of the screen or the controller at the bottom of the screen.
Tool Bar
![]() View CalTester Report Summary Page 1 - This button helps to control the right side of the screen. When selected, the right side of the screen displays page 1 of the CalTester report, which contains a summary of the full report.
View CalTester Report Summary Page 1 - This button helps to control the right side of the screen. When selected, the right side of the screen displays page 1 of the CalTester report, which contains a summary of the full report.
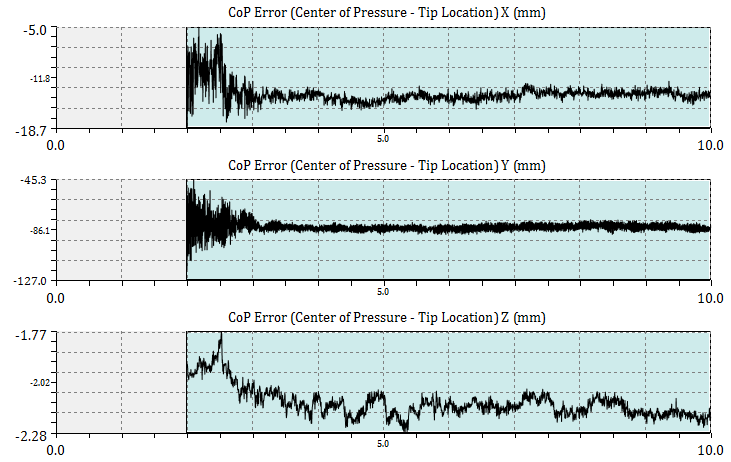
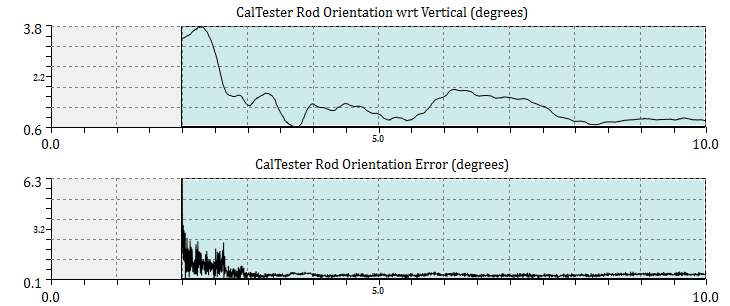
![]() View CalTester Report Graphs Page 2 - This button helps to control the right side of the screen. When selected, the right side of the screen displays page 2 of the CalTester report, which contains graphs for the Ground Reaction Force Magnitude, the CoP Error (X, Y & Z), and the CalTester Rod Orientation Error.
View CalTester Report Graphs Page 2 - This button helps to control the right side of the screen. When selected, the right side of the screen displays page 2 of the CalTester report, which contains graphs for the Ground Reaction Force Magnitude, the CoP Error (X, Y & Z), and the CalTester Rod Orientation Error.
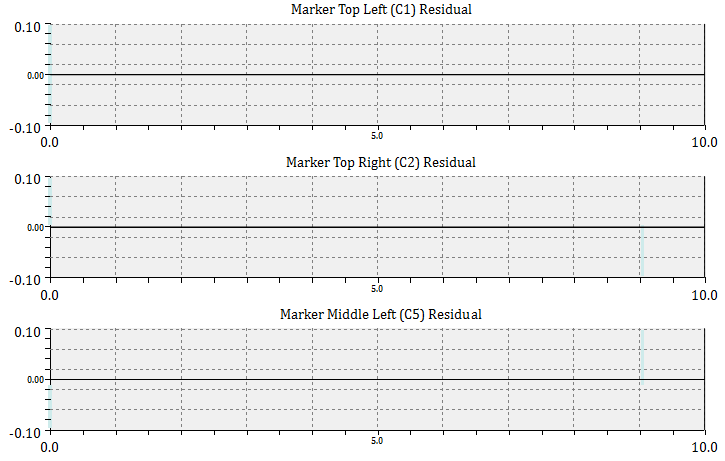
![]() View CalTester Report Graphs Page 3 - This button helps to control the right side of the screen. When selected, the right side of the screen displays page 3 of the CalTester report, which contains graphs for the CalTester Segment Residual, and Marker Residuals (Top Left, Top Right, Middle Left, Bottom Left, and Bottom Right).
View CalTester Report Graphs Page 3 - This button helps to control the right side of the screen. When selected, the right side of the screen displays page 3 of the CalTester report, which contains graphs for the CalTester Segment Residual, and Marker Residuals (Top Left, Top Right, Middle Left, Bottom Left, and Bottom Right).
![]() Zoom in on the report - This button allows the user to zoom in on the page of the report that is shown on the right side of the screen.
Zoom in on the report - This button allows the user to zoom in on the page of the report that is shown on the right side of the screen.
![]() Zoom out of the report - This button allows the user to zoom out on the page of the report that is shown on the right side of the screen.
Zoom out of the report - This button allows the user to zoom out on the page of the report that is shown on the right side of the screen.
![]() Modify CalTester Rod Dimensions - This button opens the Rod Dimensions dialogue box. Further details on the function of the dialogue box can be found here.
Modify CalTester Rod Dimensions - This button opens the Rod Dimensions dialogue box. Further details on the function of the dialogue box can be found here.
![]() Modify Force Platform Parameters - This button opens the Modify Force Platform Parameters dialogue box. Further details on the function of the dialogue box can be found here.
Modify Force Platform Parameters - This button opens the Modify Force Platform Parameters dialogue box. Further details on the function of the dialogue box can be found here.
![]() Modify Force Structures - This button opens the Modify Force Structure Parameters dialogue box. Further details on the function of the dialogue box can be found here.
Modify Force Structures - This button opens the Modify Force Structure Parameters dialogue box. Further details on the function of the dialogue box can be found here.
![]() Force Platform Locator - This button opens the Force Plate Location dialogue box. Further details on the function of the dialogue box can be found here.
Force Platform Locator - This button opens the Force Plate Location dialogue box. Further details on the function of the dialogue box can be found here.
Controller
The controller allows the user to run through the 3D animation. On the left hand side of the controller there are five blue buttons which allow the user to play/pause, jump to the beginning/end, and jump forward/back one frame at a time. The text box to the right of the play buttons tells the user which frame the 3D view is on, with the corresponding time next to it. The slider beneath the frame box allows the user to increase or decrease the speed of the playback from 0.5 to 5 times its normal rate. The blue slider indicates where in the c3d file the 3D view is; it can also be used to control scrolling through the file. The radio button at the far right allow the user to switch between playing the 3D view at its capture rate and every frame.
Understanding the Report
In order for a report to be created the files must be loaded into Visual3D while the CalTester tab is being used.
Page 1
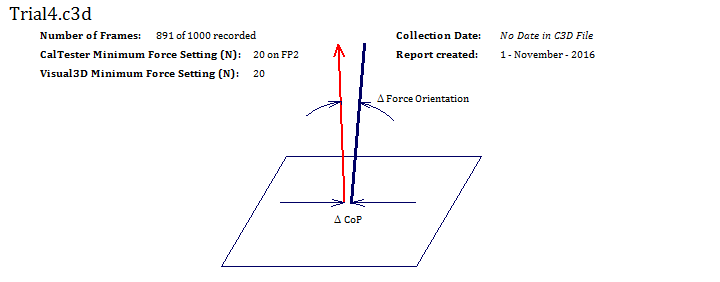
The Laboratory Calibration Test Report includes the mean, standard deviation, and range (minimum and maximum) of the four report variables. These are provided on graphs and with numerical values.
(1) The background on the file: the top of the report contains the summary of the c3d file being used. This includes the number of frames used, the minimum force settings (for CalTester and Visual3D), and the dates the c3d file was collected and when the report was created.
(2) The report format: the second section of the report provides an overview of how the information on the rest of the page will be organized.
(3) The Difference in Force Orientation Error: this is the angle (in degrees) between the applied force reaction vector (i.e., the ground reaction force minus the weight of the calibration-testing rod) and the orientation of the long axis of the rod, as determined from the target data.
Note: The force orientation variable is calculated from the dot product of this predicted unit vector and the vector along the axis of the rod as determined with the motion capture system.
(4) The differences in CoP (for x, y, and z): these are the components of the displacement vector between the CoP location measured by the force platform and the endpoint of the calibration-testing rod (adjusted for the specified vertical height above the force platform).
Differences can be due to many different factors, including errors in the force platform configuration (analog scale factors, force platform origin specification), the force platform interface (channel connections and assignments), or the force platform alignment (corner locations, which are used to transform force platform data into the laboratory coordinate system). Differences due to the kinematic system are related to uncorrected camera non-linearities, poor 3D calibration, and target image distortions.
If CalTester detects large differences, additional data collection trials may be helpful in identifying the source(s) of the differences. The additional tests may include separate data collection trials using movement arcs in only one of the vertical planes, or a circular movement arc. Tests in each of the four quadrants of the force platform may also be helpful. The significance of the measured differences is a professional judgment that must be made by each laboratory in light of its specific applications. (Keep in mind that the measurement resolution of laboratory systems will limit how small one can reasonably expect the differences to be.) Also, the CalTester technique is sensitive to a great many parameters, but the process of identifying the parameter(s) that most contributes to differences will likely require a thorough understanding of the measurement systems by the user.
If CalTester detects an inconsistent value for the location of the origin of the force platform, it assumes that the data file was generated from a VICON system and indicates that beside the filename on the report.
Page 2
The magnitude of the force vector and the error signals are displayed in the Graphs tab of the Report.
The CalTester Center of Pressure error is measured and graphed for the X, Y and Z directions for each of the frames of data.
The orientation of the rod with regards to the vertical is graphed as well as the error of the orientation.
From this view the user can select the range of data to be processed. This will allow the user to eliminate anomalous data from the calibration calculations. To select the range, left click and drag the mouse on the Ground Reaction Force Magnitude graph. A green highlighted section will appear on the graph and all of the graphs will be limited to this range. To return to the original range, left click on the Ground Reaction Force Magnitude graph and the full range will return to all of the graphs.
Page 3
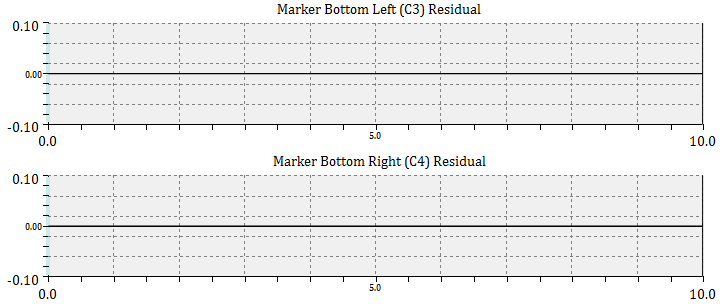
The third page of the report has six graphs. The first graph is the CalTester Segment Residual Graph. This graph shows the residual of the whole CalTester Segment during the trials that were used.
The final five graphs show the residuals for the individual markers. For the sample shown below the markers that are used are: C1, C2, C5, C3, and C4.
Tutorials
The following sections have step-by-step instructions on how to use the CalTester Tab.
|
In order to use the CalTesterPlus program you need a set of properly collected data for each force platform you wish to calibrate. To collect a useful static trial for CalTester follow the following process.
|
|
In order to use the CalTesterPlus program you need a set of properly collected data for each force platform you wish to calibrate. To collect a useful motion trial for the report mode follow the following process.
|
|
The report capabilities of the CalTester tab creates an error report based on collection trials. 1. Add C3D files In order to open a C3d file for use in the CalTester tab you must first navigate to the CalTester tab and leave it active. The C3D files are then opened by clicking on the open button. 2. Check Report Once the files are loaded the right side of the CalTester tab will show the first page of the CalTester report. You can navigate between the three report pages by using the page buttons in the tool bar. 3. Print Report The report that has been generated on the right side of the screen can be saved as a pdf document by using the file drop down menu and selecting Print or by using the Ctrl + P short cut. 4. Understanding the Report A detailed explanation of how to understand the report that CalTester produces can be found here. Note: If there appears to be errors or discrepancies in the report or the 3D-view check that the markers have been identified correctly and that the rod dimensions are correct using the Modify CalTester Rod Dimensions button. |

