Sift - Global Gait Asymmetry
| Language: | English • français • italiano • português • español |
|---|
Overview of LGGA
The Global Gait Asymmetry (GGA) and Linear Global Gait Asymmetry measure (LGGA) were developed by Cabral et. al. [1] as a method of deriving a single biofeedback metric for asymmetry assessment during gait. Walking and running are highly cyclic activities that are considered naturally symmetrical, and high asymmetry levels may be associated with pathologies or unilateral injuries [1]. Asymmetric comparisons and symmetry rehabilitation have shown to be an important clinical target, particularly in ACL reconstructive surgery. The LGGA was developed to improve gait symmetry retraining methods and tests the effectiveness of classify induced asymmetry [1]. The original definition of the LGGA uses the three dimensional joint angles that are time normalized to left and right gait cycles, including the hip, knee, ankle, trunk wrt pelvis, and the pelvis wrt the lab [1]. The implementation of the LGGA in Sift follows the mathematical principals of Cabral et. al., however, allows users to specify the kinematic and kinetic measures to include.
Mathematics of LGGA
the following equation considers xl and xr to be individual points of the left and right matching signal components. All signals are time normalized to 101 points. The root mean squares difference is used to find the GGA of each signal. In Sift, these individual GGA values are stored so that a user can compare the contributions of individual signals to the whole asymmetry score. A global LGGA score is computed by a sum of all GGA values. The following equation from Cabral et. al. has 15 individual GGA components (v15) in their asymmetry index [1].
GGA in Sift
Here we will walk through an example of how to calculate GGA values on a dataset in Sift, and plot and export our results. This tutorial is a general example, and should be applicable to any gait data that has LINK_MODEL_BASED signals and gait events.
Load Library
If not already loaded, use the load library dialog ![]() to load your CMZ workspaces into Sift.
to load your CMZ workspaces into Sift.
LGGA Dialog
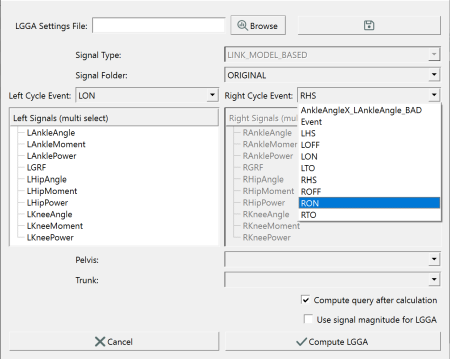
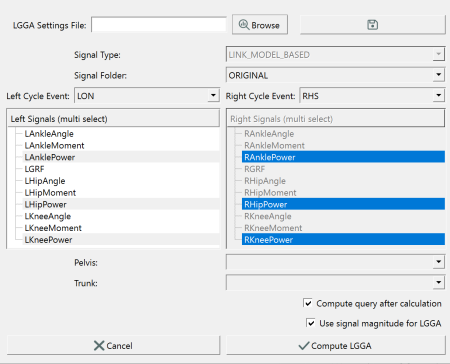
In the main toolbar, the Gait Scores icon ![]() will open the dialog for selecting the GGA settings. Here we will keep the default ORIGINAL folder selection for the LINK_MODEL_BASED data. The left and right events will be used to normalize the library signals into gait cycles with 101 points. The events are populated by Sift based on the event names in the underlying c3d files. Here we will select the LON and RON as the gait events for normalization. We then choose the signals to build our GGA components. Here we have selected the three power signals from the left signal list. The matching right signals are auto-selected. Compute query after calculation is checked so the results will be loaded into Sift after computing. We have checked "use signal magnitude" so that the signal components (X,Y, and Z) will not have individual GGA scores. In this case, the length of the signals will be used so only one GGA score will be given to each signal. The total LGGA value will be composed of independent gait asymmetry scores from AnklePower, KneePower, and HipPower. If we left "use signal magnitude" unchecked, the LGGA would be composed of independent gait asymmetry scores from AnklePowerX, AnklePowerY, AnklePowerZ, KneePowerX, KneePowerY, KneePowerZ, HipPowerX,
HipPowerY, and HipPowerZ.
will open the dialog for selecting the GGA settings. Here we will keep the default ORIGINAL folder selection for the LINK_MODEL_BASED data. The left and right events will be used to normalize the library signals into gait cycles with 101 points. The events are populated by Sift based on the event names in the underlying c3d files. Here we will select the LON and RON as the gait events for normalization. We then choose the signals to build our GGA components. Here we have selected the three power signals from the left signal list. The matching right signals are auto-selected. Compute query after calculation is checked so the results will be loaded into Sift after computing. We have checked "use signal magnitude" so that the signal components (X,Y, and Z) will not have individual GGA scores. In this case, the length of the signals will be used so only one GGA score will be given to each signal. The total LGGA value will be composed of independent gait asymmetry scores from AnklePower, KneePower, and HipPower. If we left "use signal magnitude" unchecked, the LGGA would be composed of independent gait asymmetry scores from AnklePowerX, AnklePowerY, AnklePowerZ, KneePowerX, KneePowerY, KneePowerZ, HipPowerX,
HipPowerY, and HipPowerZ.
Compute LGGA
After we are happy with the GGA/LGGA definition made in the dialog, we can choose to save these settings for future LGGA calculations by selecting the save icon on the top right of the LGGA Dialog. Previously defined settings can also be loaded here so users do not have to redefine the LGGA for multiple processing sessions. once computed, the LGGA1 and LGGA1_Components will appear in the groups window of Sift.
View and Export Results
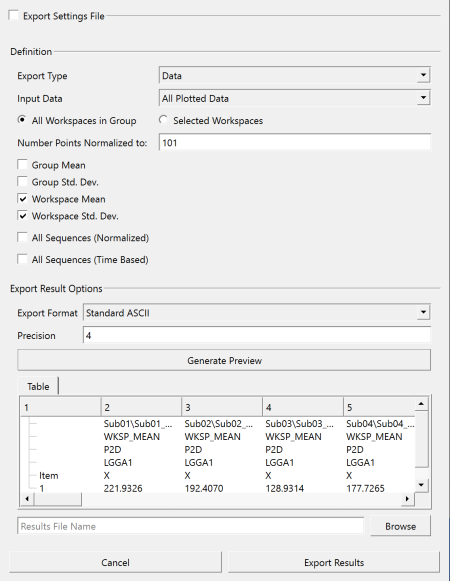
We can view the LGGA results on the Sift Explore Page by plotting the LGGA or LGGA_Components group, depending on the kinds of comparisons we want to make. Here we have selected the LGGA1 group and all subgroups. Let's say we want to compare the asymmetry values between subjects, which are represented by their independent CMZ workspaces. I have selected plot workspace mean and standard deviation for my figure refinement. The LGGA scores computed for the c3d files are stored as metrics, and can be plotted as Metrics or Metric-Metric. To export figures, we can right click on the selected plot and hit export graph. To export our metric data results, we can select the export text results icon ![]() in the main toolbar. In this dialog we will change the default settings so that we export the workspace mean and standard deviation values of the LGGA results to reflect our plotted data.
in the main toolbar. In this dialog we will change the default settings so that we export the workspace mean and standard deviation values of the LGGA results to reflect our plotted data.

References
[1] Cabral S., Resende R.A., Clansey A.C., Deluzio K.J., Selbie, W.S., Veloso A.P., "A Global Gait Asymmetry Index", Journal of Applied Biomechanics, 2016, 171-177. (https://pubmed.ncbi.nlm.nih.gov/26502455/)


