Reporting Example 3
| Language: | English • français • italiano • português • español |
|---|
Introduction
A customer wanted to add an annotation to the normative graph at the location of the corresponding normative event label. This would be equivalent to the option to annotate a graph comprised of time based signals. Rather than leave the customer with no options, we explored the following "kludgy workaround".
This example allows you to specify the normative event from the datatable (i.e. you can calculate the time of the normative event). This example shows you another method which lets you explicitly define when the annotation should be created.
You can download the sample files for this tutorial here.
Create Event stored in P2D
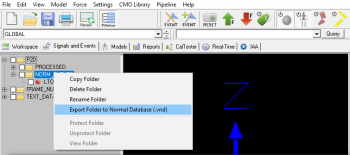
The first step is to store the value we want to create the annotation at. In this tutorial, the value is going to be stored GLOBAL::P2D::NORM_EVENTS::LTO.
- Option 1: Explicitly specify this value as 40% of the gait cycle (running data)
- Option 2: Calculate the average time toe off occurs from a normal databse
Option 1: Explicit
Explicitly define the value:
Evaluate_Expression
/EXPRESSION=40
! /SIGNAL_TYPES=
! /SIGNAL_FOLDER=ORIGINAL
! /SIGNAL_NAMES=
/RESULT_TYPES=P2D
/RESULT_FOLDERS=NORM_EVENTS
/RESULT_NAME=GLOBAL::LTO
! /APPLY_AS_SUFFIX_TO_SIGNAL_NAME=FALSE
;
Option 2: Calculate from database
Calculate the average value from the normal database:
- Load the database (Step 1)
- Run a script to calculate the % the event occurs during the gait cycle (example, when toe off occurs during the gait cycle). An example script is provided below:
Select_Active_File
/FILE_NAME=EACH_CMO_WORKSPACE
/QUERY=
;

Metric_Time_Between_Events
/RESULT_METRIC_NAME=LStance
/RESULT_METRIC_FOLDER=EVENTS
/EVENT_SEQUENCE=LHS+LTO
/EXCLUDE_EVENTS=
! /GENERATE_MEAN_AND_STDDEV=TRUE
! /APPEND_TO_EXISTING_VALUES=FALSE
;

Metric_Time_Between_Events
/RESULT_METRIC_NAME=LGaitCycle
/RESULT_METRIC_FOLDER=EVENTS
/EVENT_SEQUENCE=LHS+LHS
/EXCLUDE_EVENTS=
! /GENERATE_MEAN_AND_STDDEV=TRUE
! /APPEND_TO_EXISTING_VALUES=FALSE
;

Evaluate_Expression
/EXPRESSION=100*GLOBAL::METRIC::EVENTS::LStance_MEAN/GLOBAL::METRIC::EVENTS::LGaitCycle_MEAN
/RESULT_NAME=GLOBAL::LTO
/RESULT_TYPE=P2D
/RESULT_FOLDER=NORM_EVENTS
;
Save P2D File
|
You can then export the P2D data as a Normal Database (Normal_Data_Events.vnd) |
Plot Event stored in P2D
Getting Started
It's assumed that you have followed the steps described here.
|
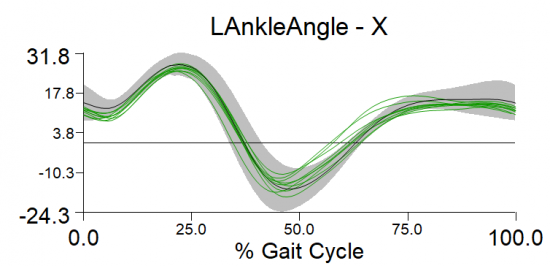
If you followed the steps correctly, you would be starting with a graph that looks like this. |
Load the P2D Data
Loads the P2D file which contains the average events:
- File -> Open
- Select the Normal_Data_Events.vnd file
Option 1: Manually Graph Event
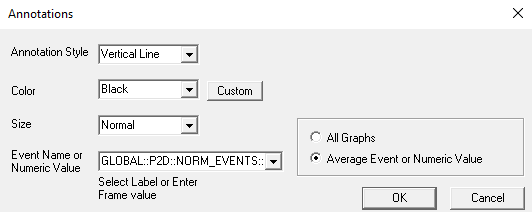
|
Option 2: Pipeline Graph Event
Add_Graph_Annotation
/PAGE_NUMBER=1
/COLUMN_NUMBER=1
/ROW_NUMBER=1
/DRAW_ORDER=2
/ANNOTATION_EVENT=GLOBAL::P2D::NORM_EVENTS::LTO
/ANNOTATION_STYLE=Vertical Line
/ANNOTATION_COLOR=Black
! /ANNOTATION_SIZE=Normal
/ANNOTATION_GLOBAL=FALSE
/ANNOTATION_AVERAGE_EVENT=TRUE
;
Final
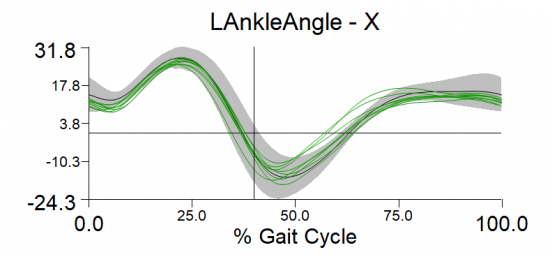
|
If everything is correct, you should see a black vertical line. |


