Tutorial Typical Processing Session
| Language: | English • français • italiano • português • español |
|---|
This tutorial covers the basic processing steps starting from C3D files through to report generation. None of these steps will be described in detail, but we will provide links to pages with more detailed descriptions.
As a starting point, we will assume that you have:
- a model template (MDH)
- a signal processing pipeline (V3S)
- a report template (RGT)
- a static trial (C3D)
- multiple movement trials (C3D)
If you don't have these templates or pipelines, you can download the sample files or follow the links to documentation on how to create them.
You can download sample C3D files to use with this tutorial here.
Creating a model
To create the model, make sure that Visual3D is started by selecting Start -> Programs -> C-Motion -> Visual3D
|
1. Load the static C3D file by going to Model -> Create (Add Static Calibration File) -> Hybrid Model from C3D file. |
|
2. Select ”LowerBodyStaticTrial01.c3d.” Click Open. |
|
Visual3D will switch to Model Building mode automatically. The 3D viewer will display the average value of the marker locations from the standing file. The dialog bar to the left of the screen will contain a list of segments, which by default will contain only a segment representing the Laboratory (e.g. Motion Capture Volume). |
Note: Your screen may look slightly different.
Applying a model template
In this section, you will apply a previously constructed model template. If you don't have a model template (.mdh file) for this standing trial, please complete the Model Building Tutorial which describes the process for building a model and creating a template.
If you have a model template, then:
|
1. Apply the model template:
2. Set the subject height/weight:
|
Using a Pipeline Command
Pipeline commands can be used to apply the model template and set the subject height/weight. These commands can be edited to look for specific files, or if parameters are left blank, they will prompt the user for relevant information.
- 1. Apply Model Template command
- 2. Set Subject Height command
- 3. Set Subject Weight command
A great example of applying a model template can be found on the following pages Pipeline Processing Example 1 and Pipeline Processing Example 2.
Opening movement files
This section will open/add the movement files to the model that was created in the previous sections on this page.
|
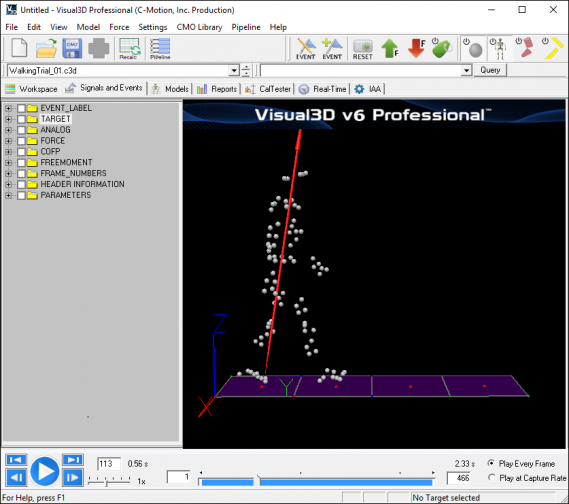
If you were able to successfully load the static trial and apply the model template by following the steps above, the static trial should appear in the Workspace tab. This means you are ready to continue onto the next step. |
|
1. Load the dynamic trials
|
|
Verify -
Verify the model file named WalkingTrial_01.c3d appears in the column labeled Motion Files. Visual3D displays the active file in the Motion Files column, but not directly beside the static trial file. |
Using a Pipeline Command
The dynamic trials can be opened using the File_Open command.
A great example of assigning models to motion files can be found on the following pages File Open.
Assigning movement files to a model
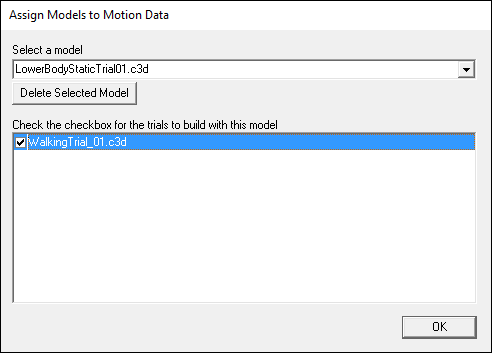
In the previous sections, the movement files were added and the model template was applied to the static standing trial. These movement files need to be associated or assigned with static standing model file. When movement files are assigned to a model, the pose (position and orientation) of each segment and landmarks in the model are computed for the motion file. To assign the movement files to a model, follow these steps:
|
1. Assign model to motion trial
|
Verify -
The 3D Animation Viewer should now display a skeleton of the lower body that has been associated with your movement data. You can animate the skeleton by clicking the PLAY ![]() button in the VCR controls at the bottom of your screen.
button in the VCR controls at the bottom of your screen.
Pipeline command for assigning a model
The model can be assigned to the movement trials using the Assign_Model_File command.
A great example of assigning models to motion files can be found on the following page Assign_Model_File.
Basic Signal Processing
Signal Processing is accomplished typically through pipeline commands. For more detail, a tutorial describing Signal Processing is available.
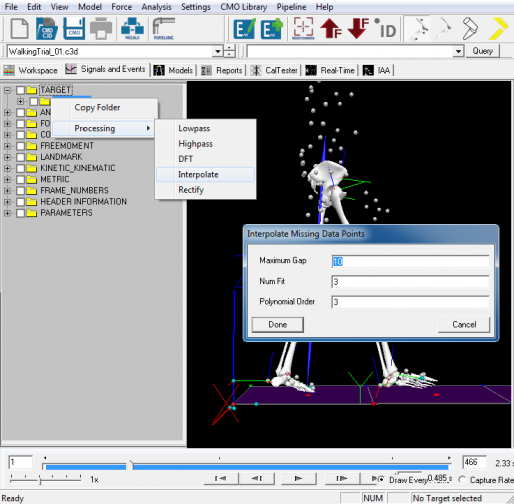
This section assumes that you have worked through the previous sections on this page. The following are steps for Interpolating and Filtering the TARGET data.
Make sure you are in the Signals and Events tab for the Processing section
|
1. Interpolate TARGET signals:
|
|
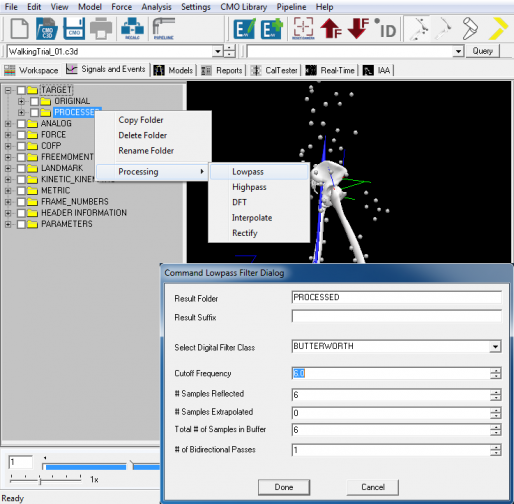
2. Filter TARGET signals:
Note that only a PROCESSED folder exists under the TARGET folder in the data tree (e.g. a new PROCESSED folder wasn't created). By default Visual3D uses only one PROCESSED folder, which contains the most recent processing done to a signal. |
|
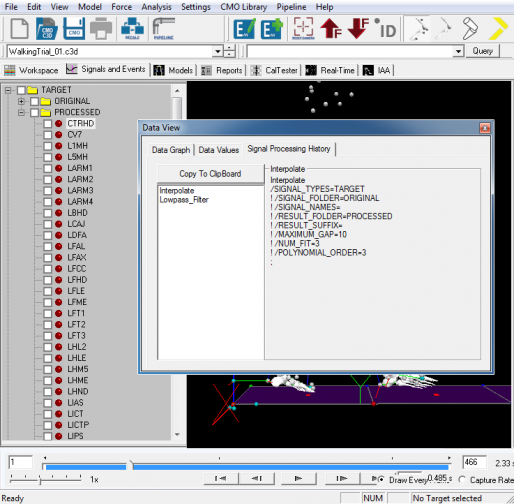
3. Review Processing History:
|
Pipeline commands for Basic Signal Processing
Signals can be interpolated and filtered using the Interpolate and Lowpass_Filter commands.
Refer to Tutorial:_Command_Pipeline#Pipeline_SIGNAL_PROCESSING for an example.
Check Force Assignments
Creating Event Labels
An Event is simply an occurrence of interest that correlates to a motion capture frame, i.e. to a particular time point within a movement. The key events for gait studies (e.g., heel strike, toe-off) are now so well standardized that Visual3D can detect and mark them automatically . For other applications, you can define your own events, either manually (using the mouse to double-click on significant points on any graph) or computationally. After you have worked through the steps in this section, refer to Tutorial:_Event_Processing for more information about creating event labels. In addition, go to Event Labels for more examples.
Entering an Event manually
Events can be added to the data file manually by selecting a frame in a graph in SIGNAL AND EVENT PROCESSING mode. Follow these steps:
|
1. Plot the signal as an Interactive Graph:
|
|
Select the graph by clicking with the Left Mouse Button on the graph. When the graph is selected you will see the handles (little rectangles) on the graph. When the graph is selected you can change the scale for the X and Y axes. You can also view a vertical line which is associated with the current frame. |
|
2. Manually create a new Event Lable
Note that the name of the Event Label can be the same as an existing label in the data tree because more than one occurrence of an Event is allowed. The buttons << and >> allow you to move the Event forward or backward through the frames. |
After an Event has been created it can be edited using the Edit Events Dialog. The process of Editing an Event is explained elsewhere.
Entering an Event manually via the pipeline
This example created an explicit event which can also be done using the Event_Explicit command.
If you are processing gait, you will want to use the Automatic_Gait_Events command.
Users can create events specific to their task (different types of motion, EMG processing, etc.) by using any combination of signal processing in conjunction with the many Event commands.
Creating model based items
Model Based Items refers to Kinematic and Kinetic calculations based on rigid body modeling.
In this section, we will create a knee joint angle. After you have worked through this section, refer to the Compute Model Based tutorial which describes the basics for creating model based items. One of the more important sections describes the interpretation of the knee joint angle.
Create a joint angles for the Right and Left Knee
To create the right knee joint angle, follow these steps:
|
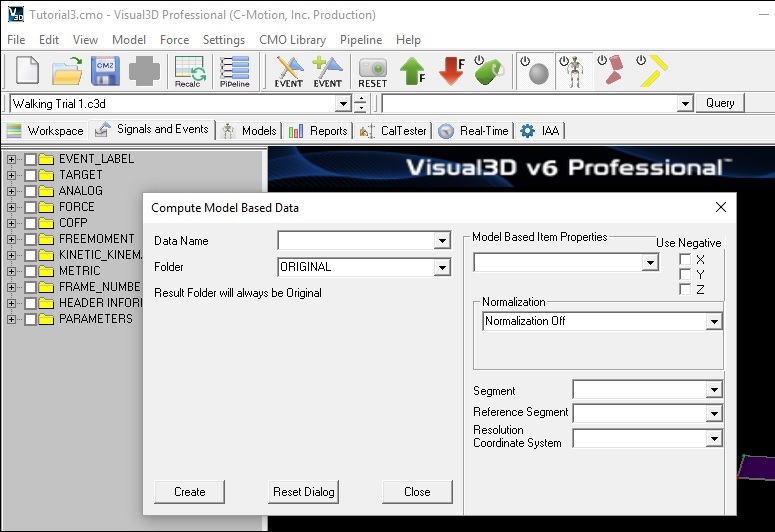
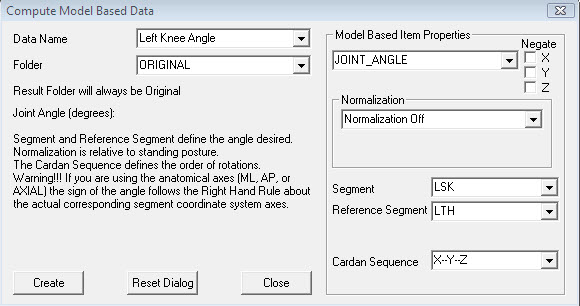
1. Under MODEL in the main menu bar, select Compute Model Based Data |
|
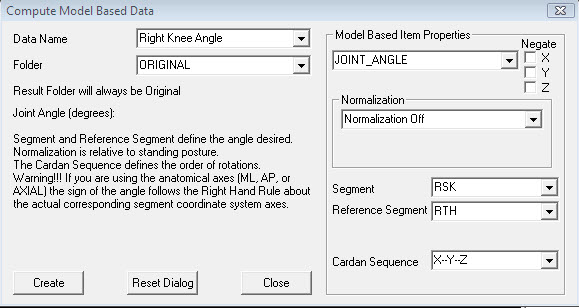
2. Define the Right Knee Angle as follows
|
|
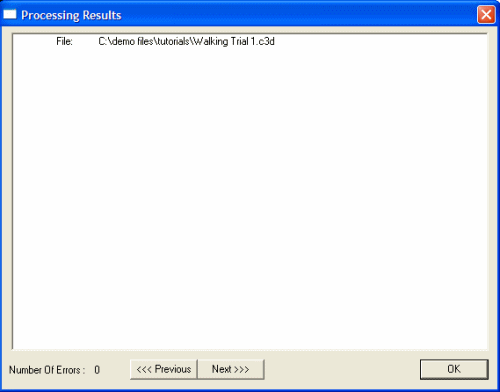
Processing Results
|
|
3. Define the Left Knee Angle as follows
|
|
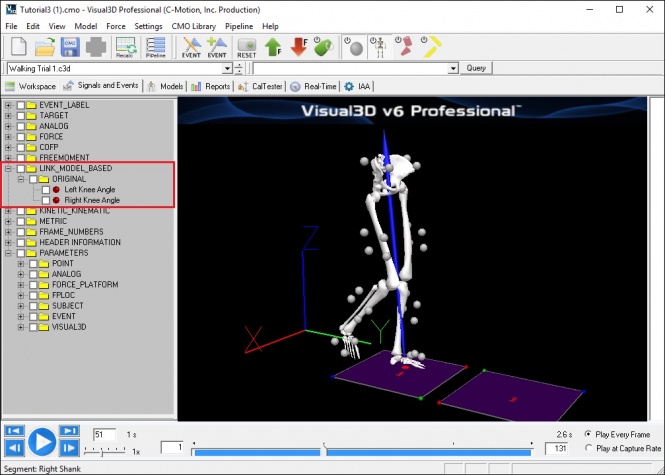
Notice that a new folder is created in the Data Tree for LINK_MODEL_BASED calculations. This folder now contains the Left Knee Angle and Right Knee Angle Signals. |
Using Pipeline Commands
Pipeline commands can be used to create the model based data. The following commands will create the left and right knee angles:
Compute_Model_Based_Data
/RESULT_NAME=Right Knee Angle
/FUNCTION=JOINT_ANGLE
/SEGMENT=RSK
/REFERENCE_SEGMENT=RTH
/RESOLUTION_COORDINATE_SYSTEM=
! /USE_CARDAN_SEQUENCE=FALSE
! /NORMALIZATION=FALSE
/NORMALIZATION_METHOD=TRUE
! /NORMALIZATION_METRIC=
! /NEGATEX=FALSE
! /NEGATEY=FALSE
! /NEGATEZ=FALSE
! /AXIS1=X
! /AXIS2=Y
! /AXIS3=Z
;

Compute_Model_Based_Data
/RESULT_NAME=Left Knee Angle
/FUNCTION=JOINT_ANGLE
/SEGMENT=LSK
/REFERENCE_SEGMENT=LTH
/RESOLUTION_COORDINATE_SYSTEM=
! /USE_CARDAN_SEQUENCE=FALSE
! /NORMALIZATION=FALSE
/NORMALIZATION_METHOD=TRUE
! /NORMALIZATION_METRIC=
! /NEGATEX=FALSE
! /NEGATEY=FALSE
! /NEGATEZ=FALSE
! /AXIS1=X
! /AXIS2=Y
! /AXIS3=Z
;
Creating a Report
|
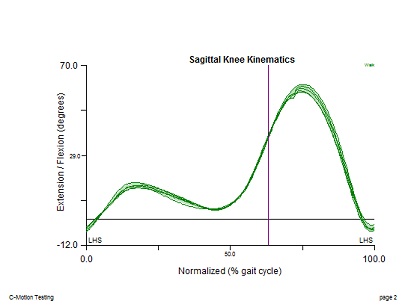
Once signals have been created, they can be added to a report. The report allows users to preview their data prior to exporting, or to share data (ex. a clinician). An example of a report may be seen on the right. The Report Building Tutorial describes the process for creating this report. Note: It is possible to add and overlay more than one item per graph so that direct comparisons between different variables can be made. |
Pipeline commands
A report may be saved as a .rgt file. The report may then be opened and applied to other subjects. The .rgt file also contains the signal definitions (the signals created using the Compute Model Based dialog/pipeline command). The Model Building Tutorial describes how to create a report and save it as a .rgt file.
Graphs can also be created using the Make_Line_Graph command. This dialog does not currently have a dialog, so it is highly recommended to familiarize yourself with the options using the dialog prior to using the command.
Updating the Model Based Computations and Graphs via Recalc
If any modification has been made to the Visual3D workspace once the Model Based Computations and Graphs have already been created, it is recommended to execute the Recalc pipeline to update the .CMO Workspace. This will Recalculate the link model, event dependencies, and execute the RECALC Pipeline.
Detailed information on the Recalc pipeline can be found here.


